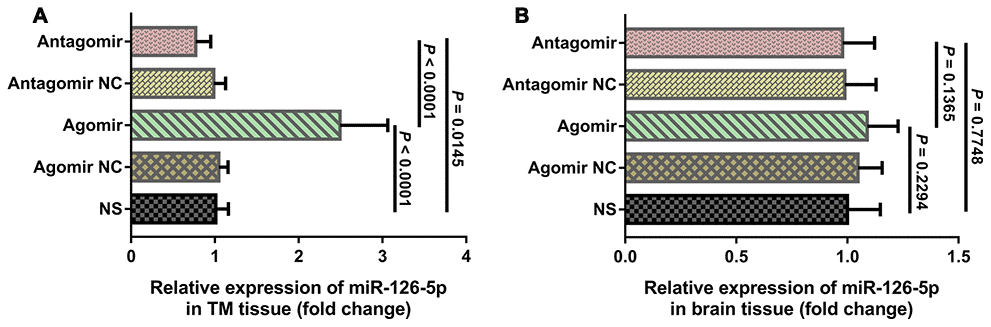
Figure 6.qRT-PCR results of miR-126-5p expression in the TM and brain tissues. (A) Column chart showing that miR-126-5p expression in TM tissue from rats in the agomir group was significantly higher than that observed in the NS and antagomir groups. (B) Column chart showing that miR-126-5p expression in brain tissue from rats in the agomir group was not significantly different from that observed in any of the other groups. The error bars represent the ±SDs. TM: temporal muscle; NS: normal saline; NC; negative control.