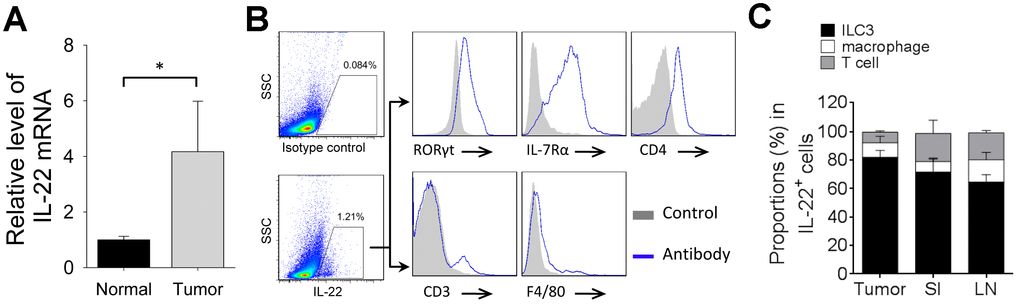
Figure 3.Cellular source of IL-22 in 4T1 tumor. (A) Total RNAs were extracted from tumor tissue or normal mammary tissue in 4T1 tumor model. qPCR was applied to analyze levels of IL-22 mRNA (n=4). Data represent fold changes. (B, C) Tumors, small intestine and mesenteric lymph nodes were collected from mice on day 21 after cell injection. Flow cytometry was applied to analyze IL-22-producing cells. (B) Figure shows cells gated from IL-22-positive population and expression of indicated markers. T cells are defined as CD3+. Macrophages are defined as F4/80+. ILC3s are defined as CD3-CD4+IL-7Rα+RORγt+. (C) Proportions of ILC3, macrophage and T-cell in IL-22-positive cells (n=4). Data are mean ± SD, compared using unpaired t test. *, p < 0.05.