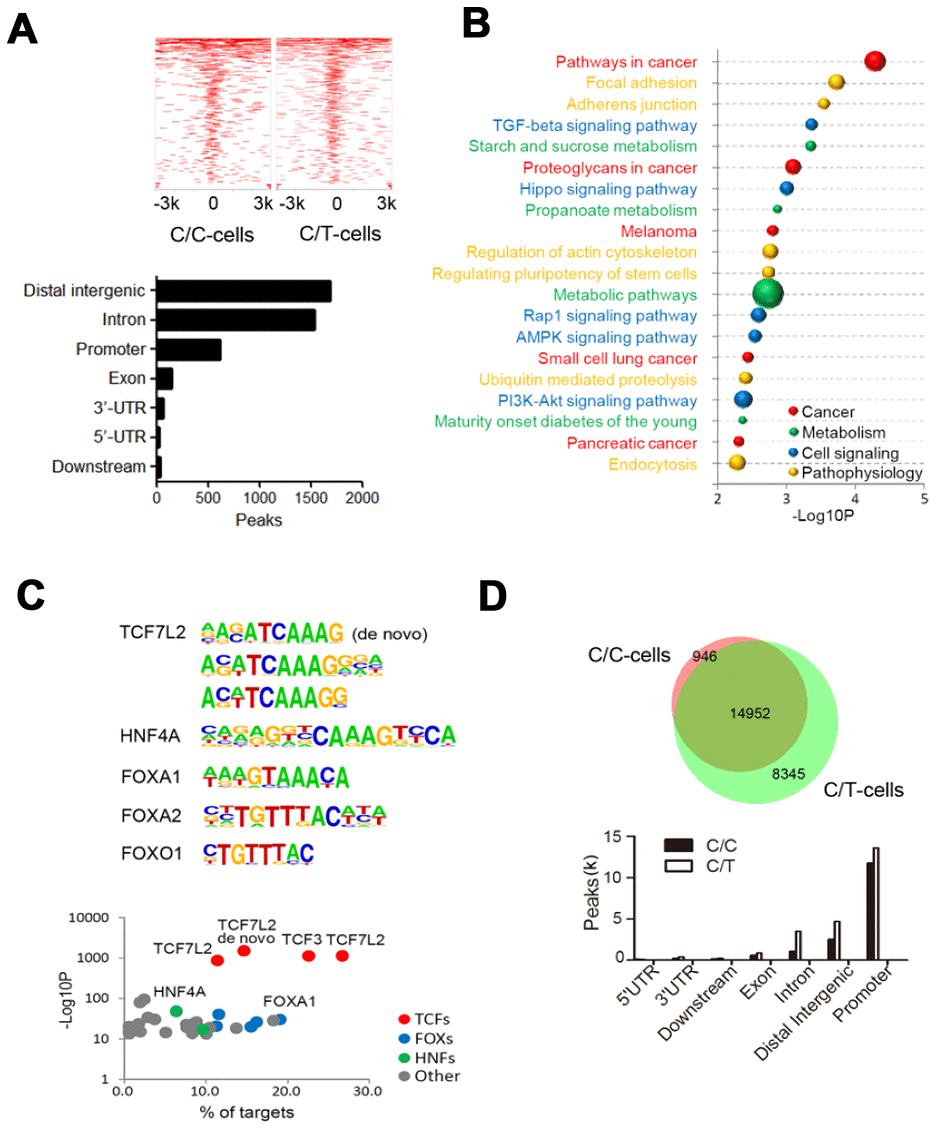
Figure 4.ChIP sequencing analysis of genome-wide TCF7L2 binding specificity in PLC-PRF-5 cells with rs290487 C/C and rs290487 C/C genotypes. (A) ChIP-seq analysis shows comparative genome-wide TCF7L2 binding in C/C and C/T cells. The clustered heatmap displays the distribution of TCF7L2 binding sites in a ±3 kb sequence relative to the transcript start site (TTS). Bar graph shows the genomic regions of differential ChIP-seq peaks. (B) The bubble chart shows the KEGG enrichment analysis of genes in the differential ChIP-seq peaks between C/C- and C/T-cells. The size of bubble represents the number of differentially expressed genes enriched in each pathway. (C) Differential motif enrichment analysis in the differential ChIP-seq peak regions. These regions are enriched for de novo and known TCF7L2 binding sites and other transcription factors that regulate gluconeogenesis. Scatter plot shows the significance of top 30 transcription factors. (D) ATAC-seq analysis of open chromatin regions in C/C and C/T cells. The Venn diagram represents the overlap of ATAC-seq peaks in both cells. The bar graph depicts the genomic regions in the differential ATAC-seq peaks.