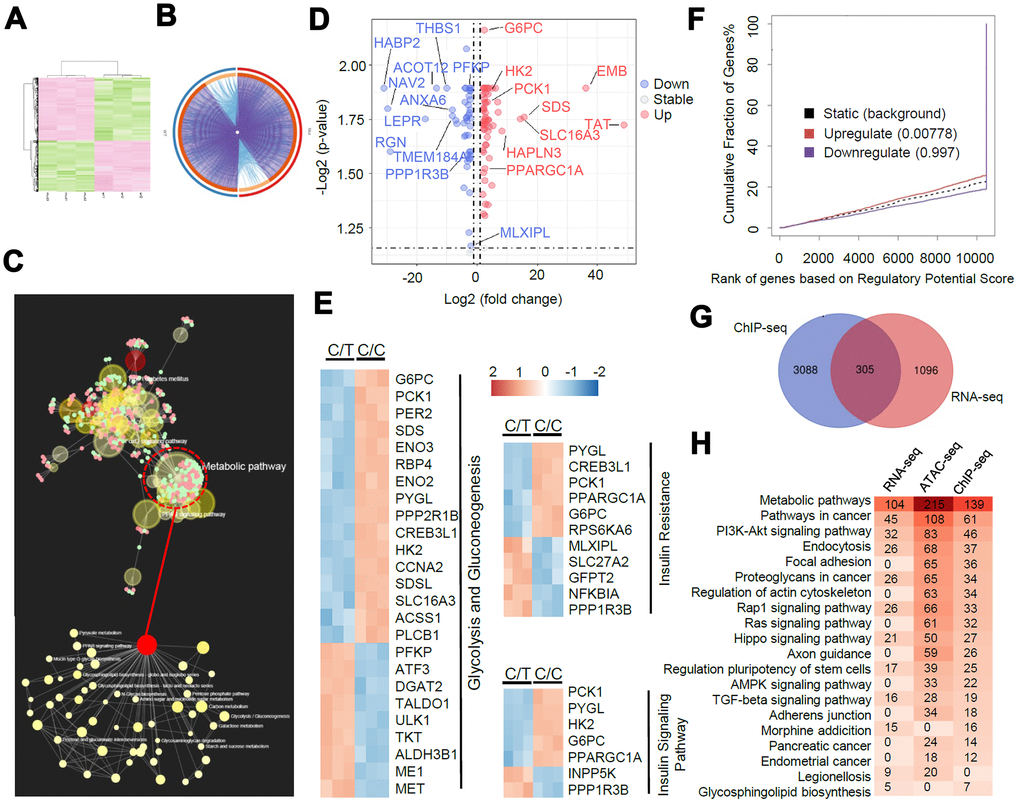
Figure 5.A genome-wide analysis of transcriptome divergence in PLC-PRF-5 cells with the rs290487 C/C genotype. (A) Heatmap of 1401 differentially expressed genes (DEGs) in C/C and C/T cells. (B) The Circos plot shows statistically significant DEGs identified by pairwise comparison of C/C vs. C/T cells. (purple lines). (C) KEGG enrichment analysis of 1401 DEGs using the MetaboAnalystR 2.0 server demonstrates strong enrichment in metabolic pathways (124 DEGs), particularly glucose metabolic pathways (red circle). (D) Scatter plot shows DEGs in glucose metabolic pathways identified by global enrichment analysis. The up- and down-regulated (fold change > 2, FDR< 0.05, P< 0.05) genes are annotated in red and blue, respectively. (E) Heatmap shows DEGs significantly enriched in glycolysis/gluconeogenesis and insulin signaling pathways. (F) BETA analysis shows integration of differential gene expression and TCF7L2 targets. The P value listed in the center represents the significance of the UP or DOWN group relative to the NON group as determined by the Kolmogorov-Smirnov test. (G) The diagram shows the overlap between the 1401 DEGs from the RNA-seq data analysis and the genes linked to the differential peaks from the ChIP-seq data analysis. (H) Integrative analysis of overlapping KEGG pathways from RNA-seq, ChIP-seq and ATAC-seq datasets. Heatmap shows the number of genes in each KEGG pathway.