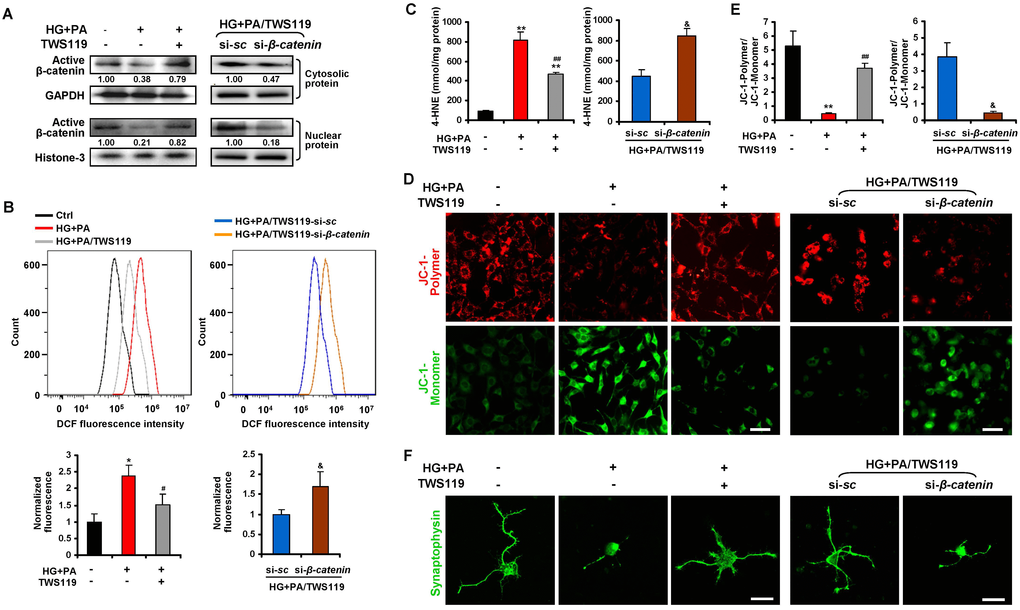
Figure 7.Dysregulated GSK3β/β-catenin signaling caused oxidative stress-associated mitochondrial and synaptic damage of primary RGCs upon glucolipotoxicity. Primary RGCs were exposed to conditioned medium (HG+PA) for 24 h, in the absence or presence of TWS119. Alternatively, RGCs were transfected by si-β-catenin or si-sc and treated with HG+PA in the presence of TWS119. (A) Western blotting for active β-catenin in cytosolic and nuclear fraction of primary RGCs. Intensities were quantified and normalized against the level of GAPDH or Histone-3 and expressed as fold changes of protein abundance relative to controls. Relative intensities of the bands are shown below. (B) Intracellular ROS production was measured by a flow cytometer. Representative curvilineal profiles of fluorescence are shown in upper panels. Quantification of intracellular ROS is shown in lower panels. Values are expressed as the fold changes relative to controls. (C) Contents of 4-HNE in primary RGCs. (D) The mitochondrial membrane potential (MMP) was determined with JC-1 using a confocal microscope. Representative images are shown (green, JC-1 monomer; red, JC-1 polymer; scale bar, 50 μm). (E) The ratio of red to green fluorescence intensity which reflects the levels of the MMP was quantified using Image-Pro Plus software. (F) Representative synaptophysin (green; scale bar, 20 μm) immunostaining in primary RGCs. Data are means ± SEM of three independent experiments. *P < 0.05 and **P < 0.01 vs normal control; #P < 0.05 and ##P < 0.01 vs HG+PA; &P < 0.05 vs si-sc. See also Supplementary Figures 6, 8A and 8B.
Figure 7 — Loss of β-catenin via activated GSK3β causes diabetic retinal neurodegeneration by instigating a vicious cycle of oxidative stress-driven mitochondrial impairment | Aging