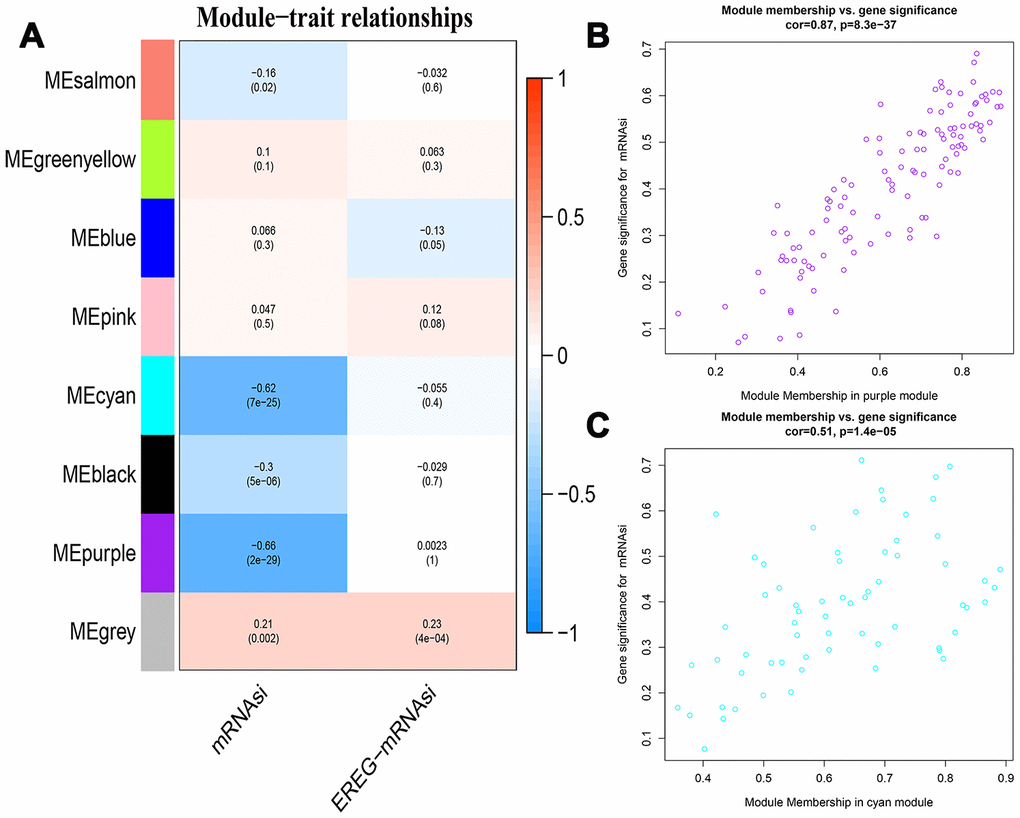
Figure 4.Identification of modules associated with stemness index in HCC. (A) The table shows the module-trait relationships of all gene modules, which are represented by different colors. Each cell in the table shows the correlation co-efficient and the p-value between the gene module in rows and the mRNAsi or EREG-mRNAsiin the columns. The degree of correlation is indicated by the color depth; red represents a positive correlation and blue represents a negative correlation. (B, C) The scatter plots of genes in the top 2 gene modules, purple (B, n=116) and cyan (C, n=44). The X axis is module membership in modules and the Y axis is gene significance for mRNAsi.