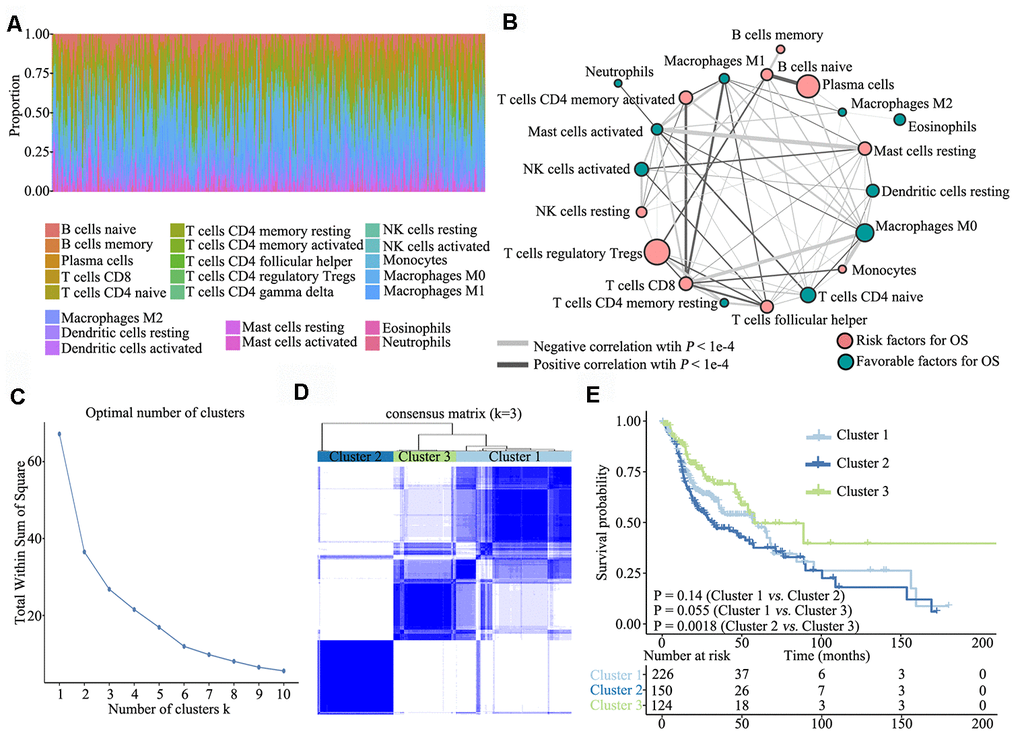
Figure 1.Overview of TME characteristics. (A) Relative percentage of each immune cell type in 502 patients with HNSCC from TCGA database. (B) Tumor–immune cell interactions. The size of each cell represents the impact of each TME cell type on survival and was calculated using log10 (log-rank test P value). Risk factors for overall survival are indicated in pink, and favourable factors are in green. The lines connecting TME cell types represent cellular interactions. The thickness of the lines represents the strength of correlation, which was estimated using Spearman correlation analysis. Negative correlation is indicated in grey and positive correlation in black. (C) The elbow criterion determines the optimal number of TME clusters (K = 3). (D) Consensus clustering analysis identification of the three TME clusters (samples, n = 500). The white (consensus value = 0, samples never clustered together) and blue (consensus value = 1, samples always clustered together) heatmap display sample consensus. (E) Kaplan–Meier curves for survival probability of the three clusters. Log-rank test was used for data analysis.