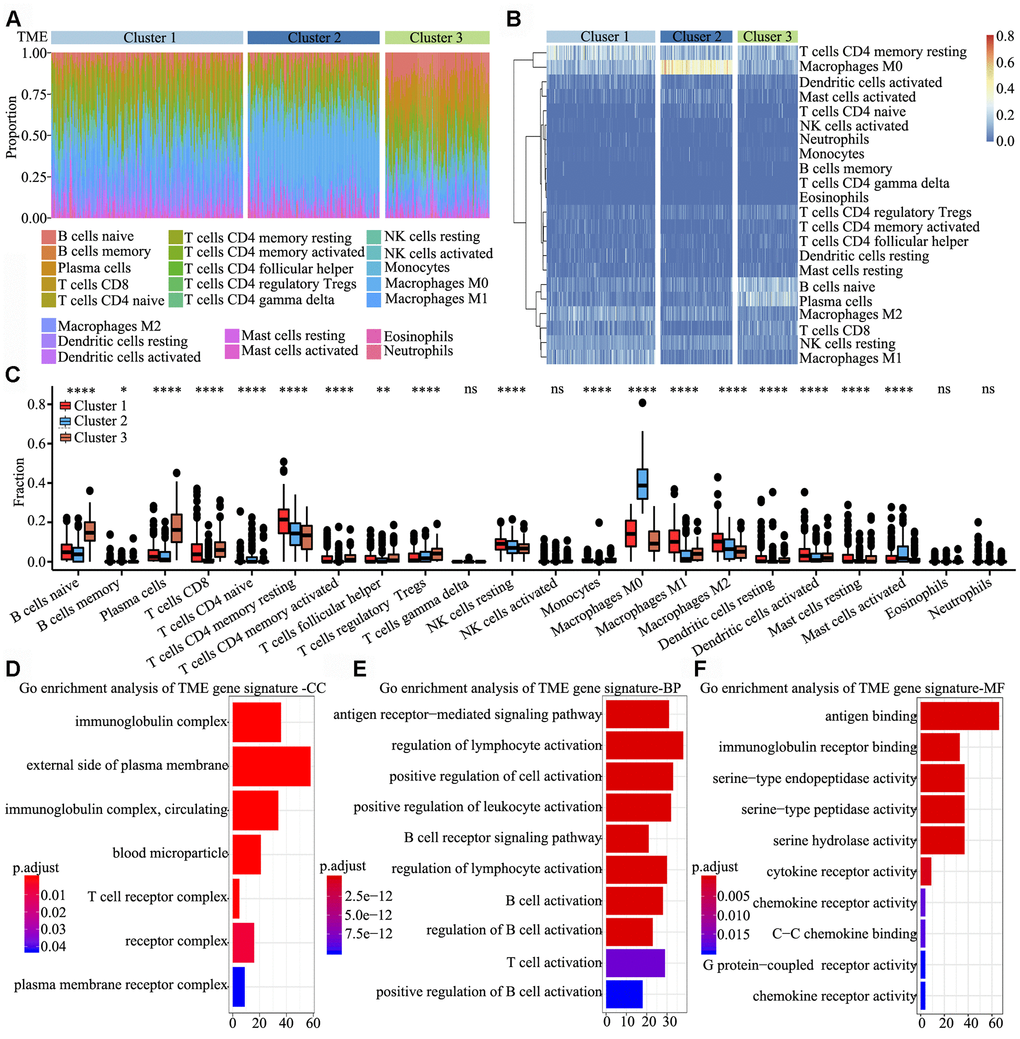
Figure 2.Signature and functional annotation of the TME clusters. (A) Relative percentage of each immune cell type in the three TME clusters. (B) Unsupervised hierarchical clustering of the clusters. (C) Relative populations of TME cells present in the three clusters. Within each group, the scattered dots represent expression values of TME cells. We also plotted the Immunoscore for the three clusters. The thick line represents the median value. The lower and upper ends of the boxes are the 25th and 75th percentiles. The whiskers encompass 1.5 times the interquartile range. Statistical differences in the three clusters were compared using the Kruskal–Wallis test. The range of P values are labelled above each boxplot with asterisks (* P < 0.05, ** P < 0.01, *** P < 0.001, ****P < 0.0001, ns = not significant). (D–F) Gene ontology enrichment analysis of TME signature genes in the cellular component (D), biological process (E) and molecular function (F) categories. The x-axis indicates the number of genes within each gene ontology term.