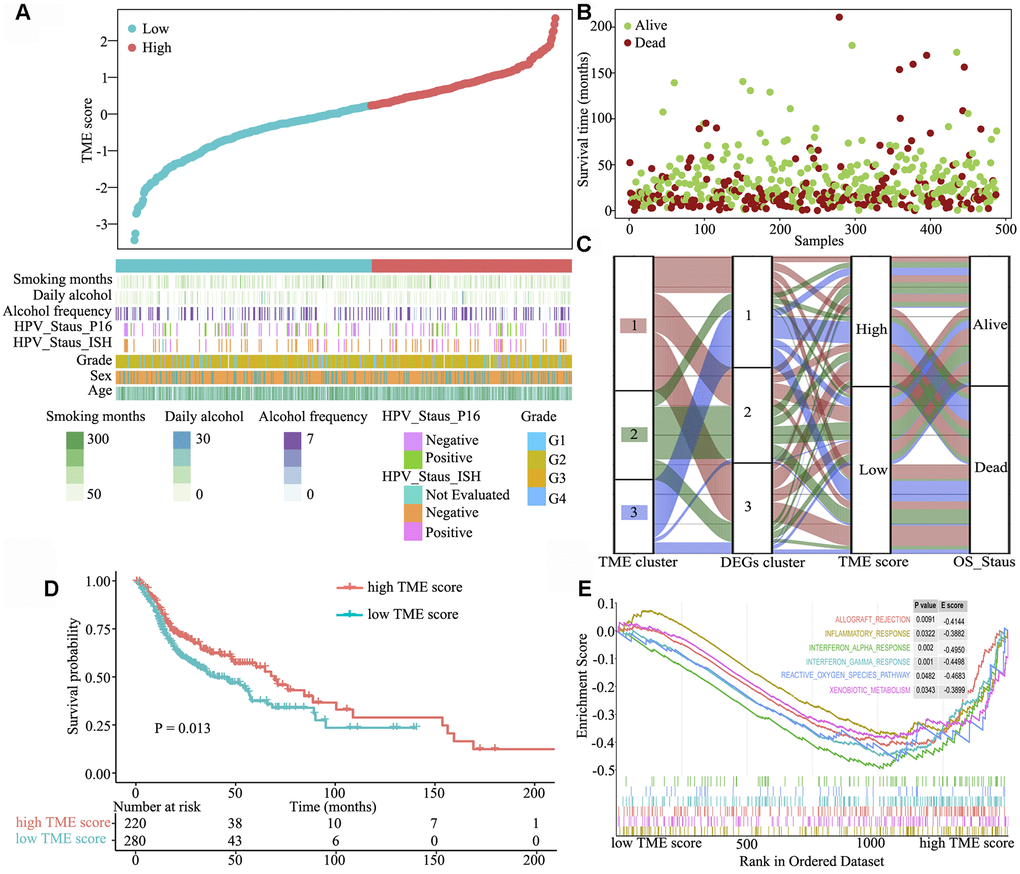
Figure 3.Clinical characteristics of the TME phenotypes. (A) TME score distribution in patients with HNSCC. (B) Overall survival status of patients with HNSCC. (C) Alluvial diagram of TME gene clusters in groups with different TME clusters, DEG clusters, TME scores and survival outcomes. (D) Gene set enrichment analysis of hallmark gene sets between the high and low TME score groups. (E) Kaplan–Meier curves for the high and low TME score groups. As evident, the high TME score group was associated with better outcomes than the low TME score group (log-rank test, P < 0.001).