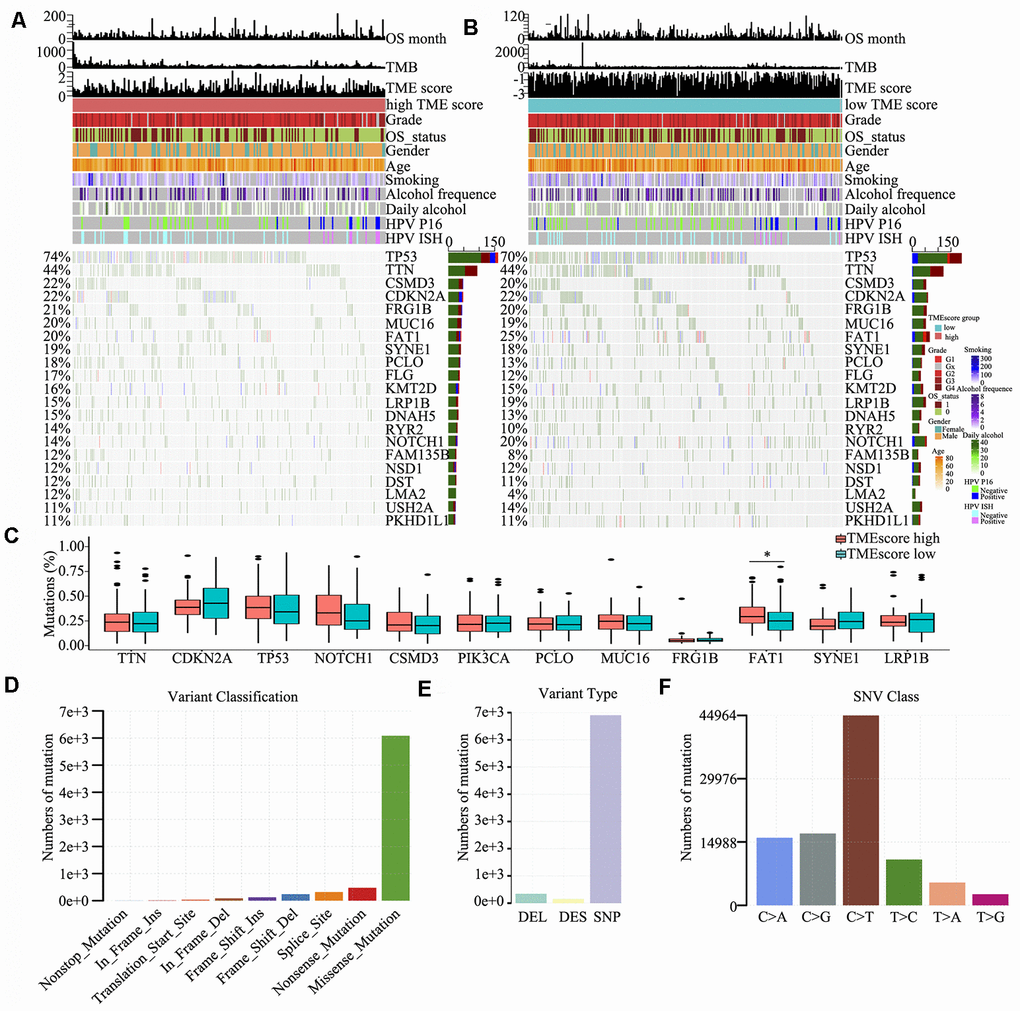
Figure 4.Somatic mutations in HNSCC. (A, B) Distribution of highly variant mutated genes correlated with TME score groups. The upper bar plot indicates overall survival (OS), TMB and TME score for each patient, whereas the left bar plot shows the mutation frequency of each gene in separate TME score groups [high (A) and low (B) TME score groups]. TME score, grade, overall survival status, gender, age, smoking, alcohol frequency, daily alcohol, HPV P16 status and HPV ISH status are shown as patient annotations. (C) Mutation percentage of common mutated genes in the TME score groups. (D) Genome variant classification. (E) Genome variant type. (F) Single nucleotide variant class.