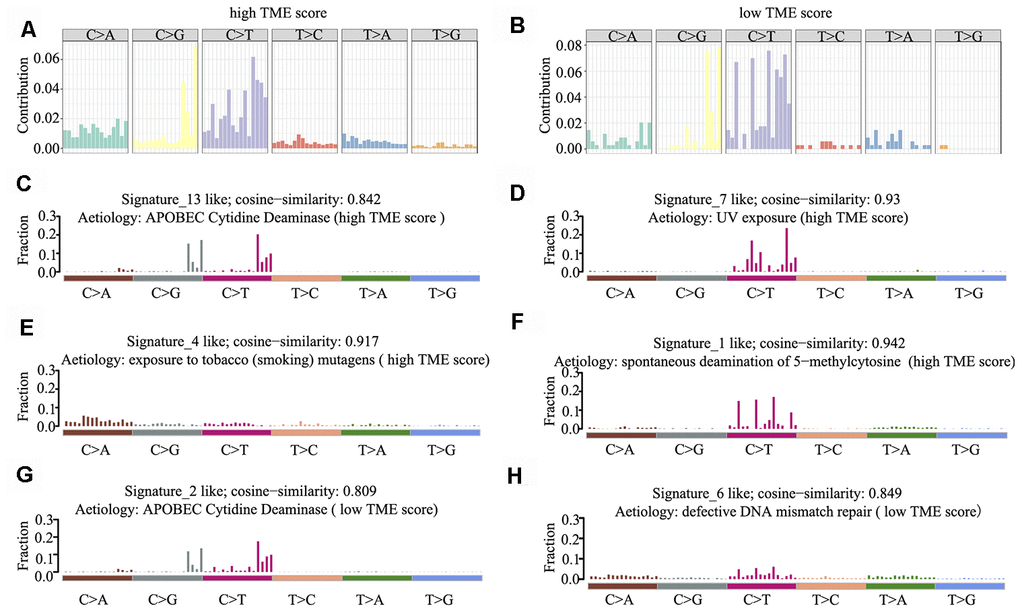
Figure 5.Mutational signature of the TME score groups. (A, B) Distribution of mutation type frequency in the high (A) and low (B) TME score groups. (C–H) Mutational signatures identified in the high (C–F) and low (G–H) TME score groups, respectively. The y-axis indicates exposure of 96 trinucleotide motifs to overall signature. The plot title indicates best match against validated COSMIC signatures and cosine similarity value along with the proposed aetiology.