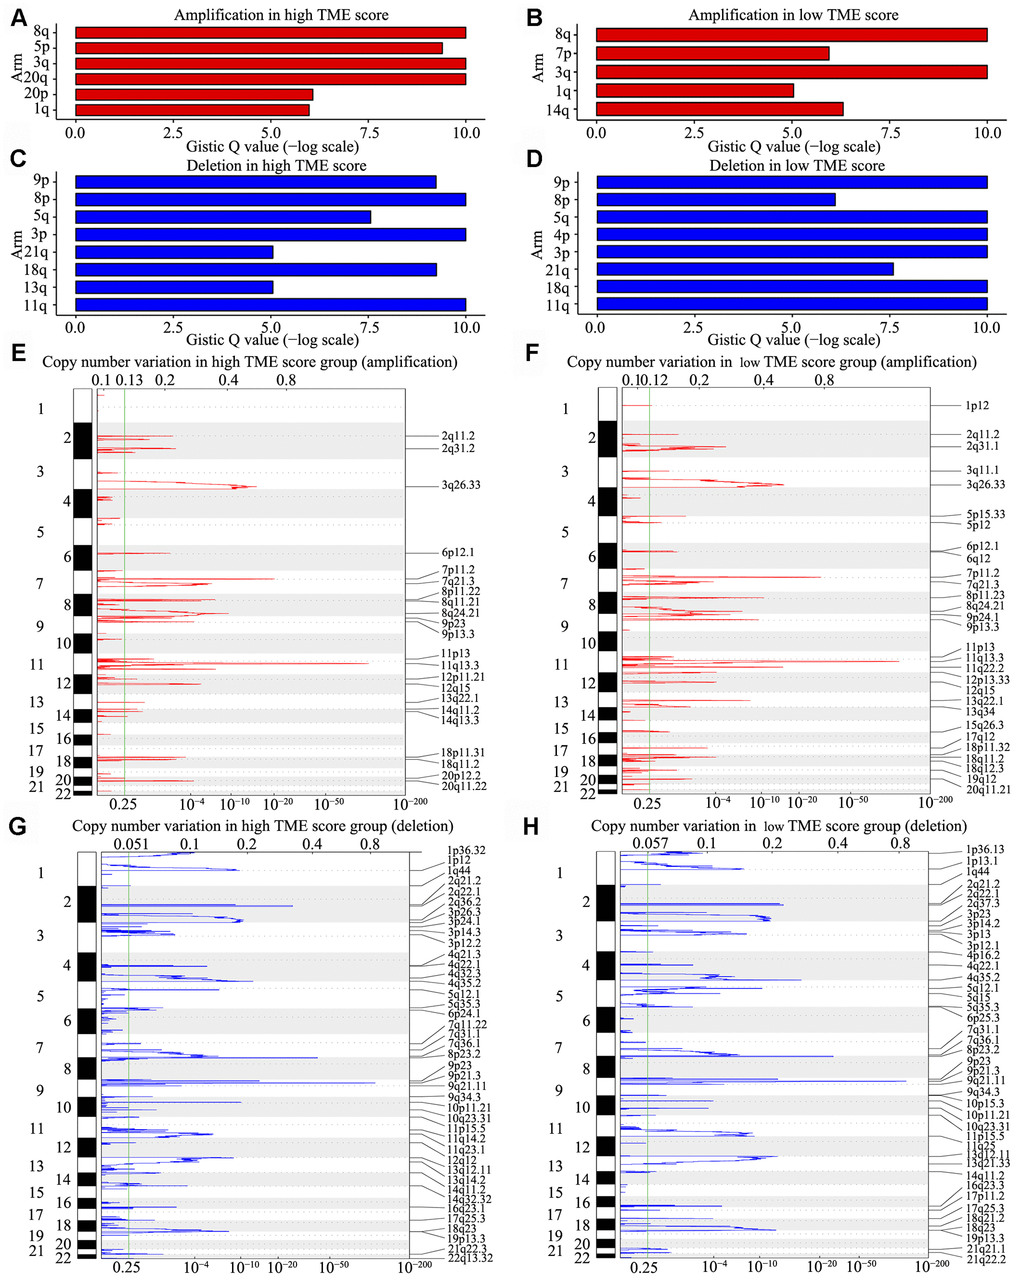
Figure 6.CNV analysis in HNSCC. (A–D) CNV at arm level. The bar graphs show the frequency of arm-level CNV amplification (A, B) and deletion (C, D), the vertical axis denotes chromosome arms. (E–H) CNV at focal regions detected by GISTIC v2·0. Regions of recurrent focal amplifications (E, F) and focal deletions (G, H) in the high and low TME score groups are plotted by false discovery rate (x-axis) for each chromosome (y-axis). Dashed lines represent the centromere of each chromosome.