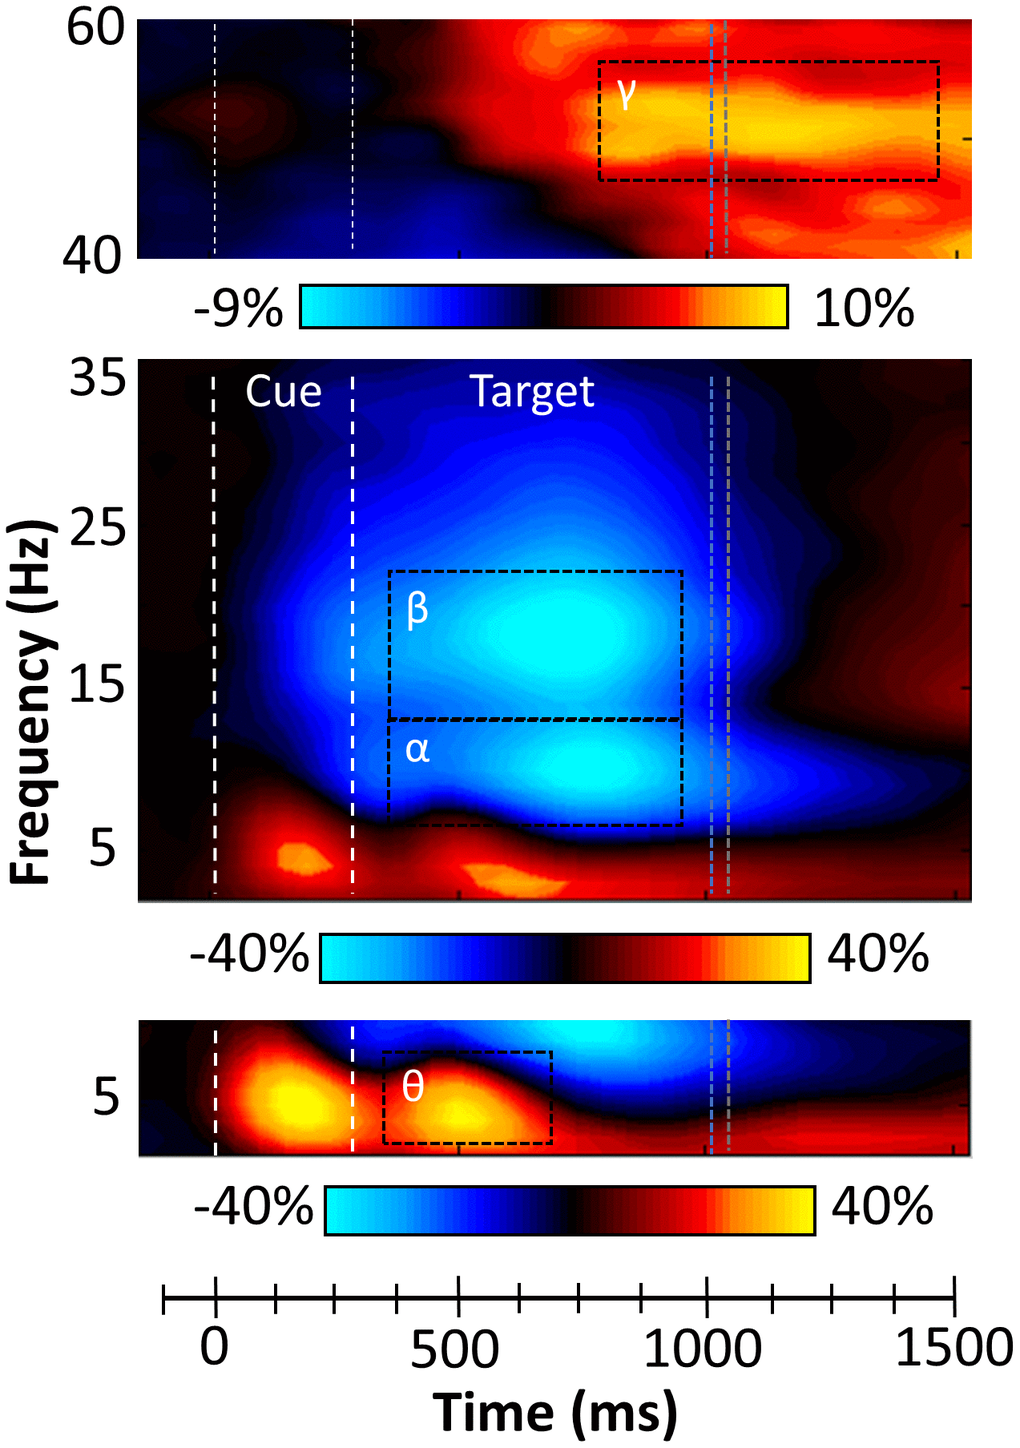
Figure 2.Sensor level time-frequency analysis. Grand averaged spectrograms for two sensors near parietal cortices with time (ms) displayed on the x-axis and frequency (Hz) denoted on the y-axis. Power is shown in percentage units relative to the baseline period (-600 to 0 ms), with a color scale bar beneath each spectrogram. The data per spectrogram have been averaged across all trials and participants. (Bottom) A strong increase in theta (3-7 Hz) power was observed following cue onset and during target processing (350-700 ms). (Middle) Strong decreases in alpha (8-14 Hz, 350-950 ms) and beta (14-22 Hz, 350-950 ms) power were also observed after the onset of the target. (Top) Robust increases in gamma (46-58 Hz) activity occurred during later target processing (850-1450 ms). All four oscillatory responses significantly differed from baseline activity in the same spectral band (p < .001, corrected), and these time-frequency windows have been highlighted using the black dotted line boundaries. Vertical blue and grey dotted lines represent the average reaction times for valid and invalid trials, respectively.