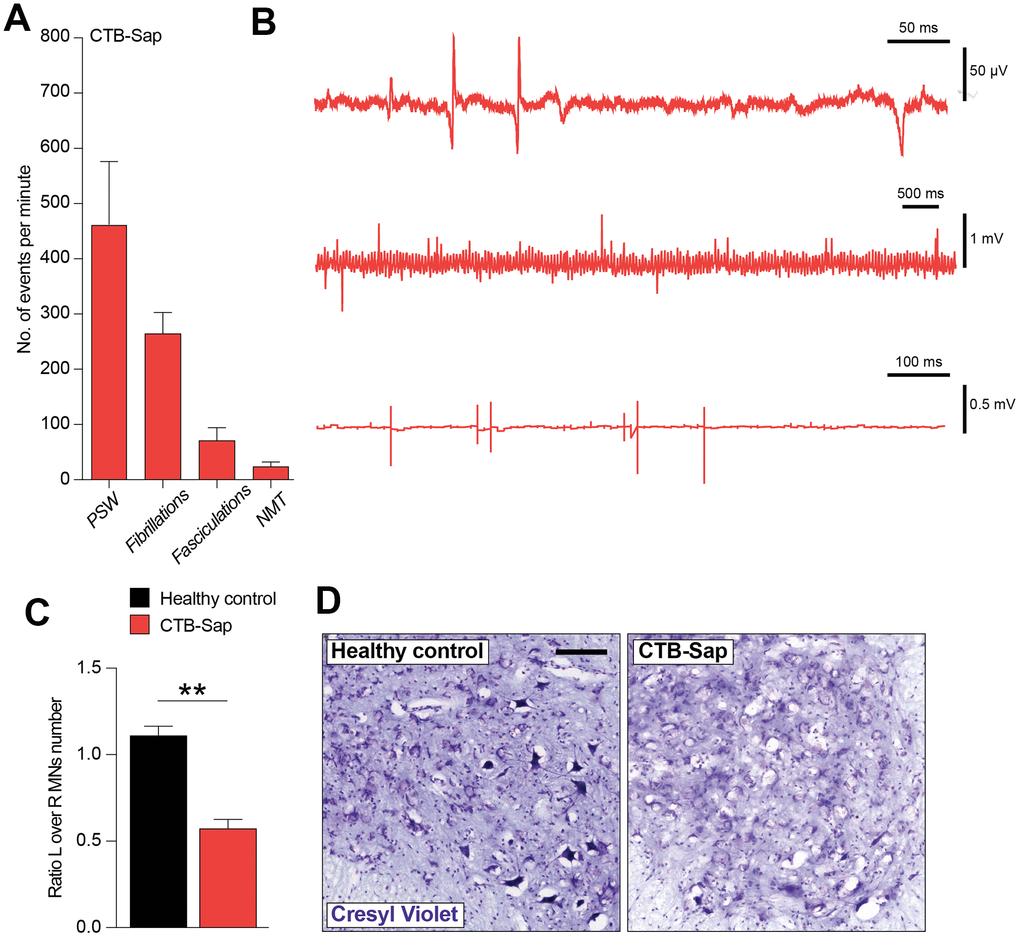
Figure 3.Electromyographic signs and neuropathological analysis of CTB-Sap lesioned mice. Quantification (A) and representative profile of electromyographic activity of gastrocnemius muscle in CTB-Sap lesioned mice. (B) positive sharp waves (PSW), fibrillations, fasciculation and neuromyotonia (NMT); data in (A) are expressed as mean events per minute ± SEM. (C) Quantification of the number of neurons in left (L) over right (R) ventral horn of CTB-Sap lesioned mice versus healthy control; data are expressed as mean ratio L over R ± SEM; **p-value < 0.01 versus healthy control. (D) Representative images of cresyl violet stained motoneurons in left Rexed lamina IX of healthy control and CTB-Sap lesioned mice. Scale bar: 100 μm. MNs: motoneurons.