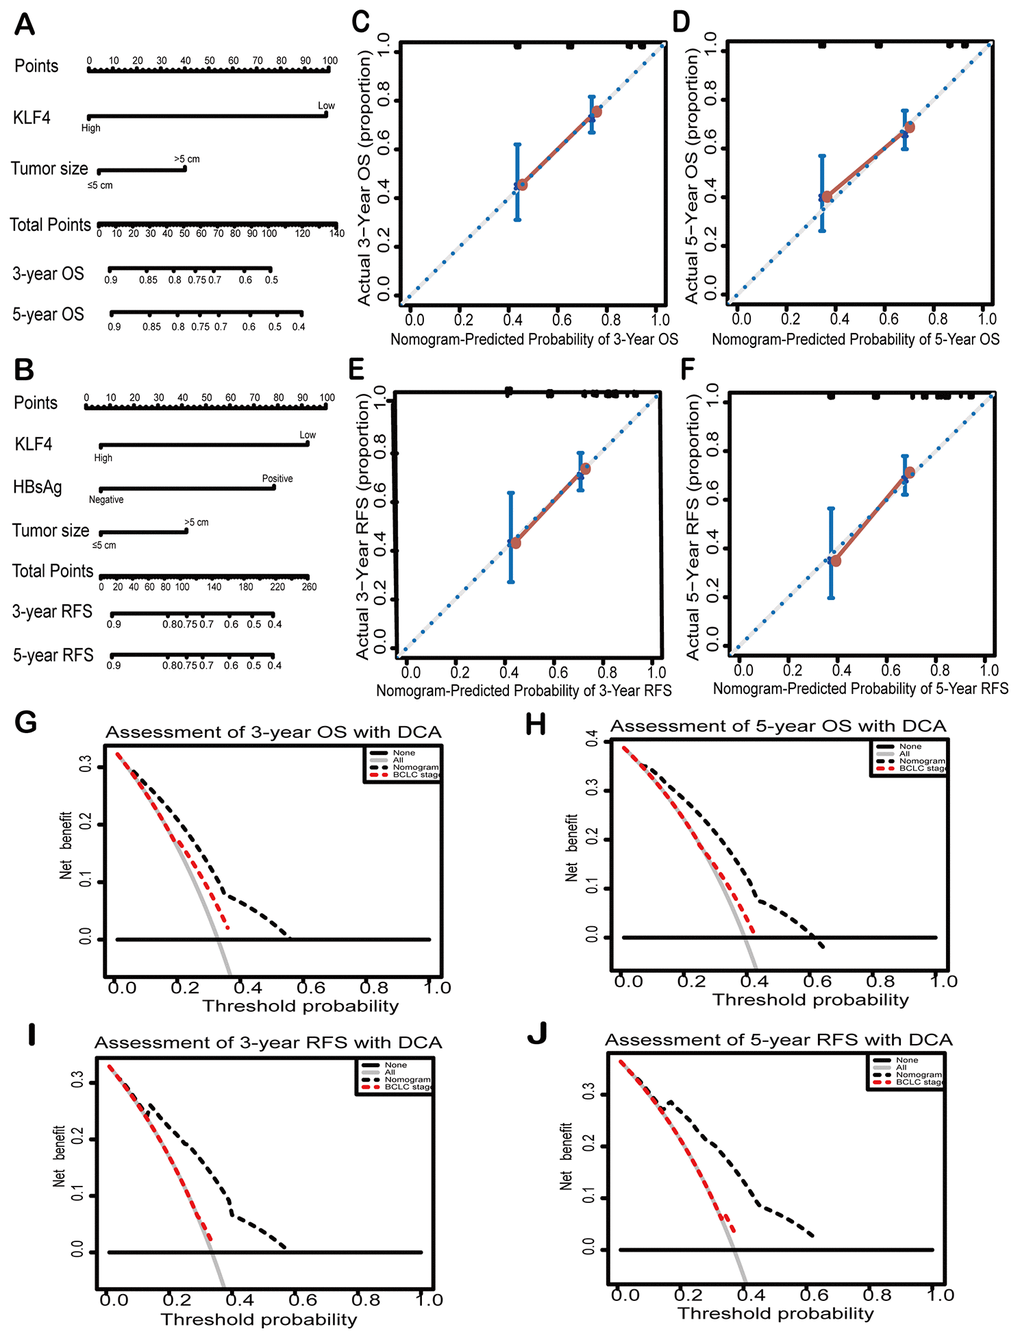
Figure 3.Nomograms and decision curves analyses were to further study the effect on the prognosis of KLF4. Pictures (A) and (D) showed the predictive analysis through prognostic nomogram. First, the plumb line between each factor and the point scale was drawn, and then got the point of each factor. The sum of the points of all factors is the total set of points. finally, a plumb line was drawn from all point scales to the probability scale to obtain the probability of OS or RFS. 3- year and 5- year OS (B and C) and 3-year and 5- year RFS (E and F) were shown by calibration curves. The X-axis represented the predicted value of OS or RFS by nomograms and the Y-axis represented actual OS or RFS. The clinical effects of different models were exhibited by decision curve analyses. The comparison of predictions between nomogram-predicted and conventional staging system for 3-year OS and RFS (G and H) and 5-year OS and RFS was shown (I and J). BCLC: Barcelona Clinic Liver Cancer staging. Dashed lines: The probability of the clinical net benefit crossing a certain threshold; the solid black horizontal line: to suppose no patients suffer the incident; the gray solid line: to assume all patients suffer the incident.