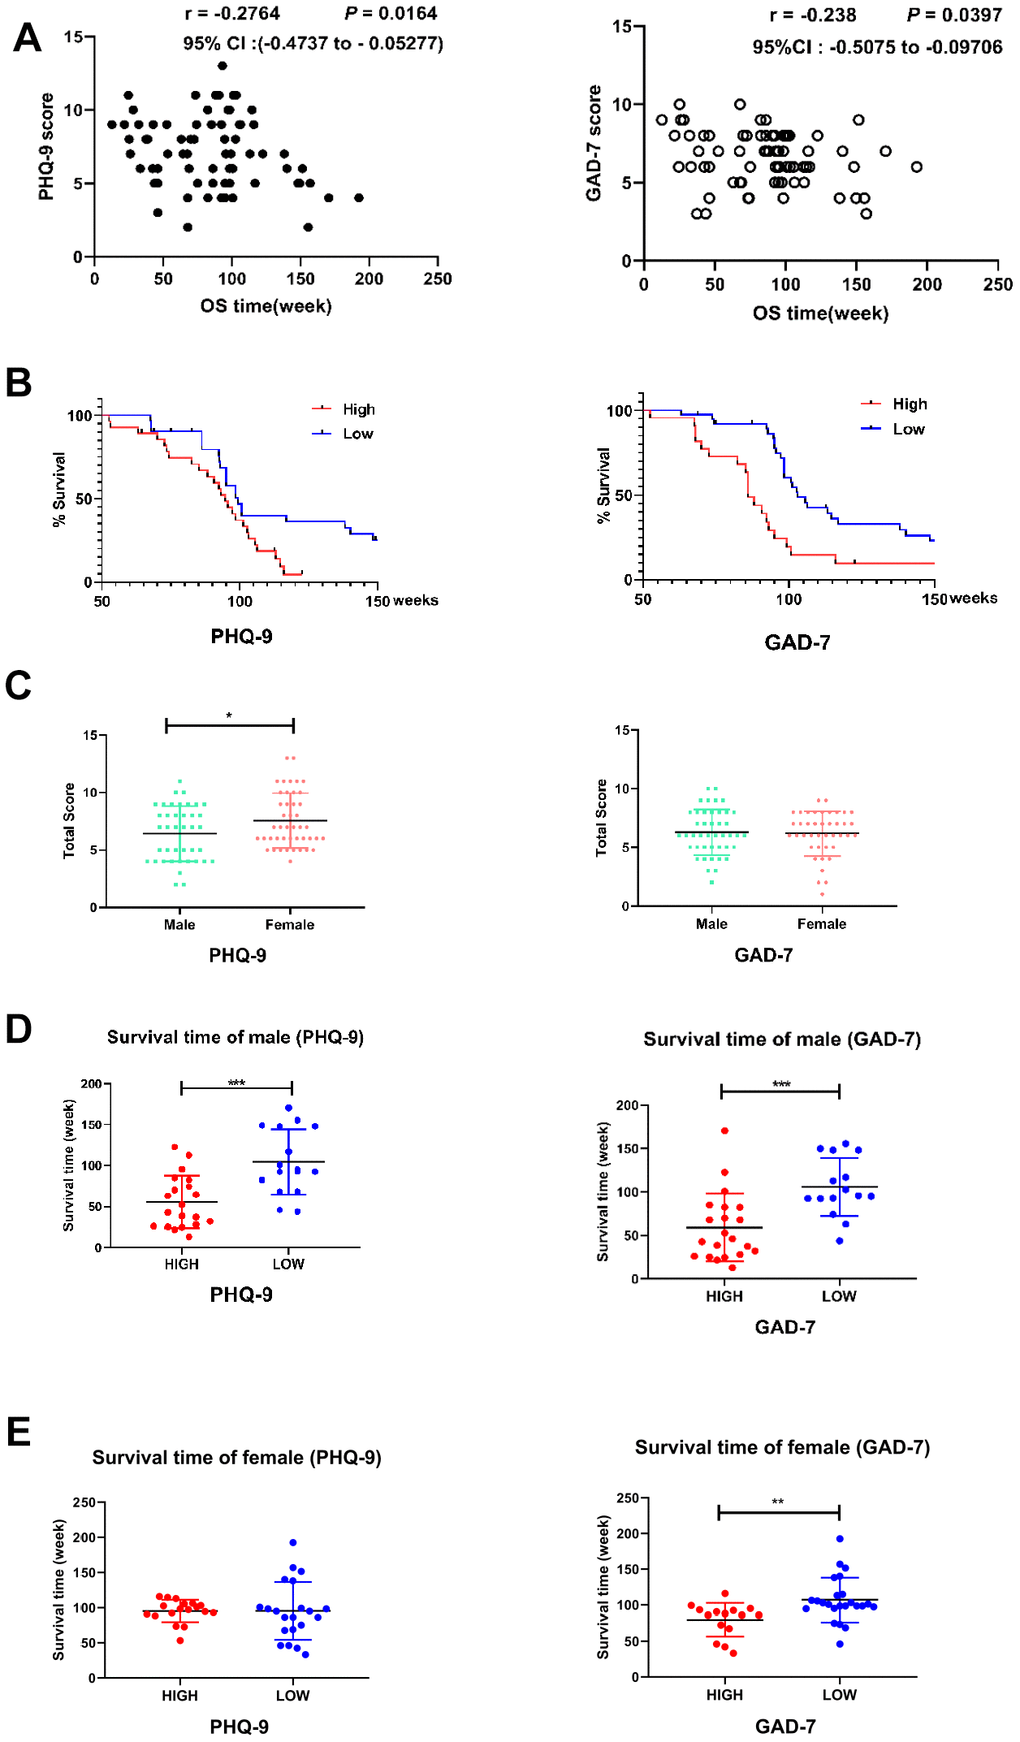
Figure 2.Correlation between the questionnaire results and GBM outcomes. (A) Scatter plots demonstrating the correlations of PHQ-9 (left) and GAD-7 (right) scores with the overall survival (OS) times in GBM patients. Pearson correlation analysis was used. The correlation coefficient, 95% confidence interval and P value are provided in the upper right corner of each plot. (B) Kaplan-Meier analyses of OS in patients with high or low PHQ-9 (left side) or GAD-7 (right side) scores. The OS times differed significantly between patients with higher (red line, n = 38) and lower (blue line, n = 36) PHQ-9 scores; P = 0.0172. The OS times also differed significantly between patients with higher (red line, n = 36) and lower (blue line, n = 39) GAD-7 scores; P = 0.002. A log-rank (Mantel-Cox) test was used. (C) Histogram displaying the differences in PHQ-9 (left side, n male = 40, n female = 44, P = 0.0378) and GAD-7 (right side, n male = 40, n female = 44, P = 0.5742) results between male and female GBM patients. Student’s t-test was used for statistical analysis. *, P < 0.05. (D) Histogram displaying the differences in OS between male GBM patients with high or low PHQ-9 or GAD-7 scores. The OS times differed significantly between male patients with high (red, n = 20) and low (blue, n = 16) PHQ-9 scores (left side); P = 0.0003. The OS times also differed significantly between male patients with high (red, n = 21) and low (blue, n = 15) GAD-7 scores (right side); P = 0.0006. Student’s t-test was used for statistical analysis; ***, P < 0.001. (E) Histogram displaying the differences in OS between female GBM patients with high or low PHQ-9 or GAD-7 scores. The OS times did not differ significantly between female patients with high (red, n = 18) and low (blue, n = 21) PHQ-9 scores (left side); P = 0.9966. The OS times differed significantly between female patients with high (red, n = 15) and low (blue, n = 24) GAD-7 scores (right side); P = 0.0054. Student's t-test was used for statistical analysis; **, P < 0.01.