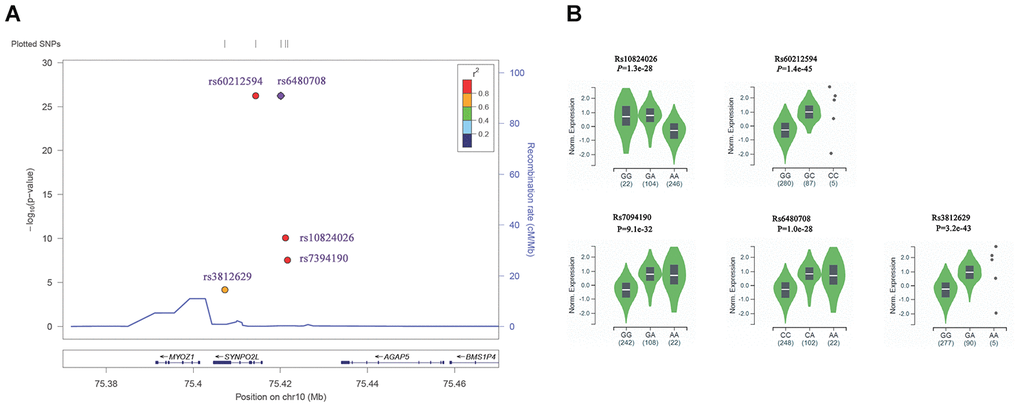
Figure 6.Association of SNPs in 10q22 with AF and eQTL analysis. (A) Regional plots for significant association with AF in 10q22. The P value was obtained from GWAS catalog database. SNPs plotted by their positions (UCSC hg19) on the corresponding chromosome against –log10 (P). Estimated recombination rates from 1000 genomes EUR populations were plotted in blue to reflect the local linkage disequilibrium (LD) structure on a secondary y axis. The most significant lead SNP (diamond) is denoted with the SNP identification number. Flanking SNPs (circles) are color-coded to represent the pairwise r2 measure of LD with the lead SNP: red, r2 ≥ 0.8; orange, 0.6 ≤ r2< 0.8; green, 0.4 ≤ r2<0.6; light blue, 0.2 ≤ r2<0.4; blue, r2< 0.2. These plots were generated by Locuszoom (https://statgen.sph.umich.edu/locuszoom/). (B) eQTL analysis showed that the association between AF susceptibility SNPs in 10q22 with the expression level of MYOZ1 in human atrial appendage tissues (n=372). eQTL analysis were performed using GTEx data.
Figure 6 — Annotation of susceptibility SNPs associated with atrial fibrillation | Aging