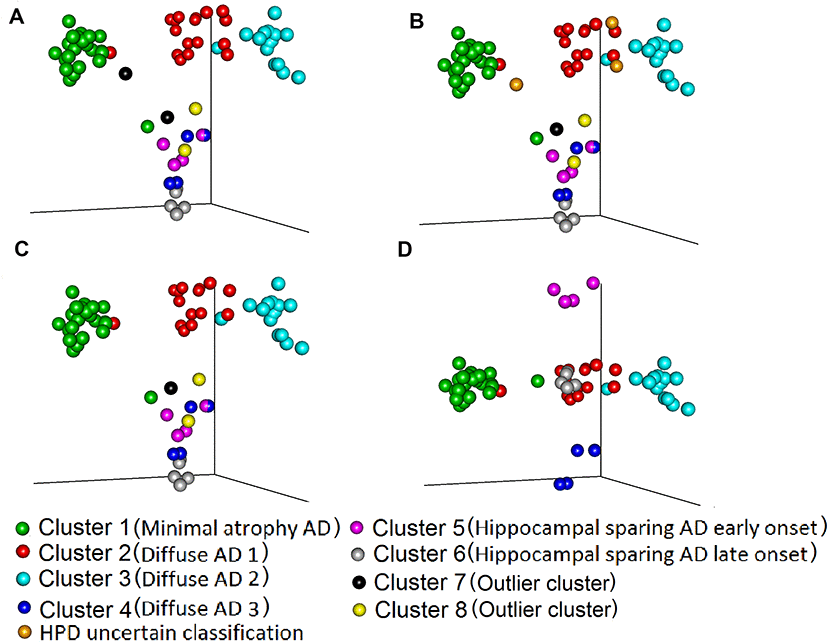
Figure 1.Comparison of maximum probability and HPD interval classifications. Three-dimensional representation of (Multidimensional scaled (MDS)) component-individual probabilities matrix (this matrix includes the probability of each subject being in any of the clusters). The scatter plots represent subjects and are coloured according to the clustering based on two approaches, maximum probability and highest posterior density intervals (HPD). (A) Subjects are coloured based on maximum probability classification (MDS components 1, 2 and 3). (B) Subjects are coloured based on HPD intervals classification. In comparison to A, in B we added the uncertain classification with orange colour (Two subject from cluster 2 and one subject from cluster 7 cannot be classified to any cluster with high certainty). (C) Colours are the same as in B, but we excluded from the plot the HPD uncertain classification subjects: orange and the outlier clusters 7: black and 8: yellow. (D) The subjects are coloured exactly as in C but the MDS components 1, 2 and 5 are plotted, to showcase the separation between cluster 4, 5 6. The names in parenthesis after the cluster numbers refer to Figure 2 and Table 2.