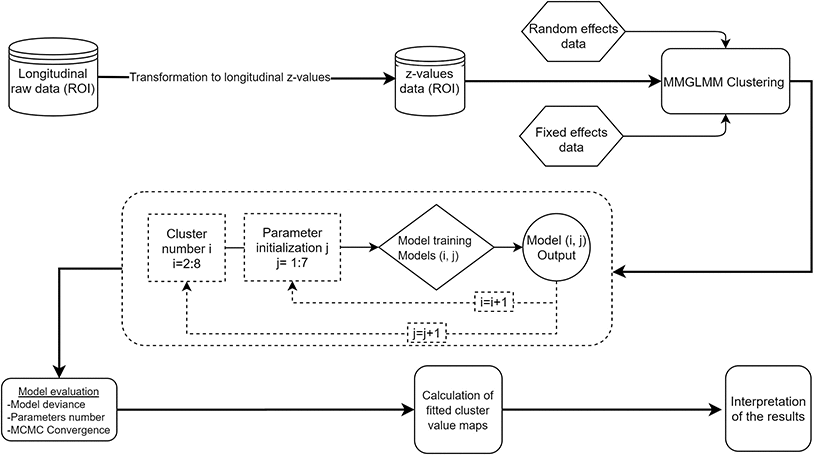
Figure 4.Flowchart of the analysis. The schematic representation of the analysis shows that all the steps after the data standardization are accomplished within the clustering and not in separate pipeline fashion like steps. ROI: region of interest, MMGLMM: Multivariate Mixture of Generalized Mixed effect Models.