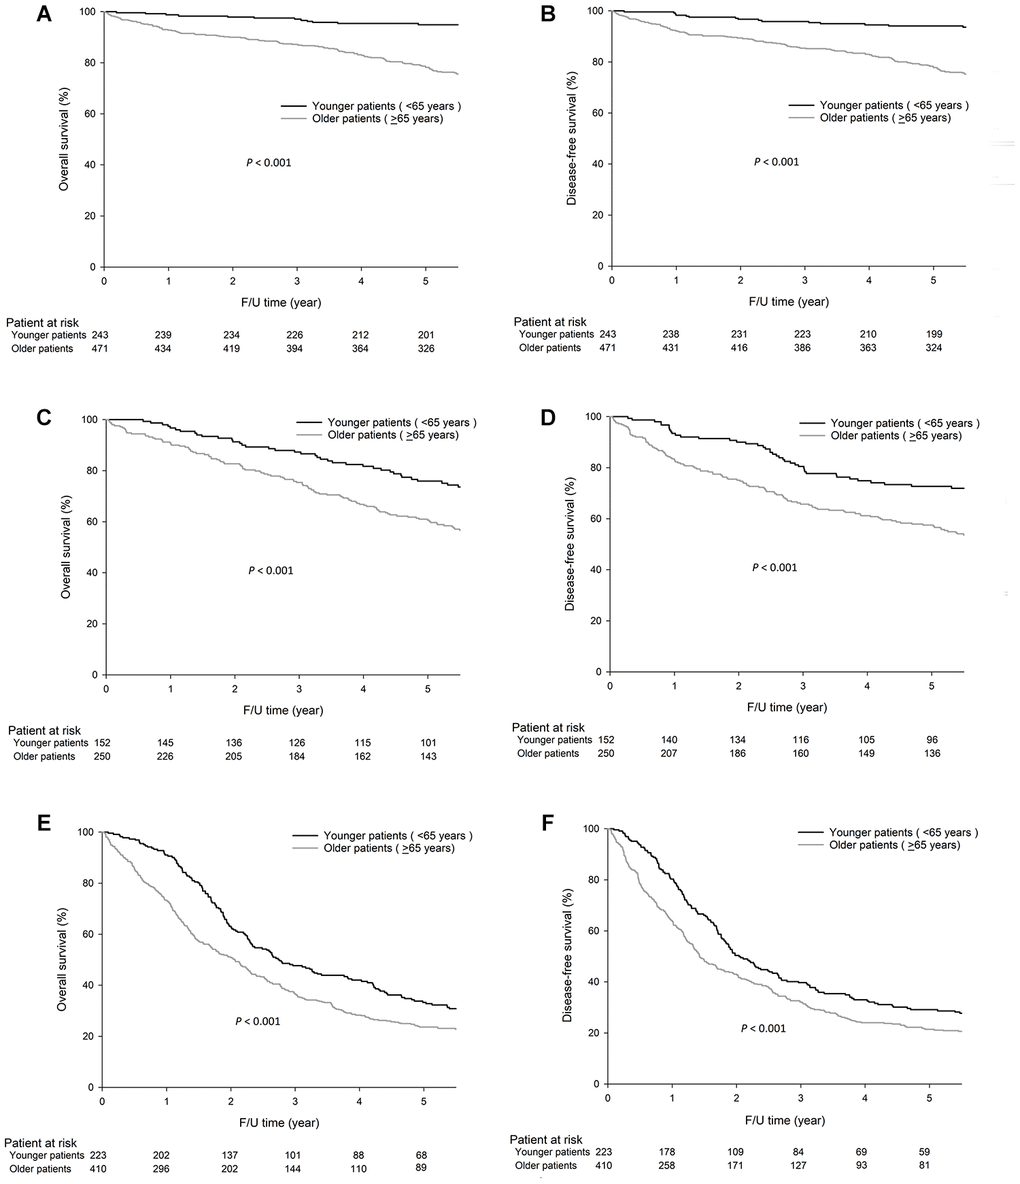
Figure 2.For stage I GC, the 5-year OS (94.9% vs. 78.2%, P<0.001) and DFS (94.1% vs. 77.8%, P<0.001) rates were significantly higher in younger patients (< 65 years) than older patients (≥65 years), and similar results were observed for stage II GC, the 5-year OS, 75.9% vs. 60.6%, P<0.001 and DFS, 72.7% vs. 57.5%, P<0.001) and stage III GC, 5-year OS, 33.3% vs. 23.6%, P<0.001 and DFS, 29.1% vs. 21.4%, P=0.001. The survival curves are shown as follows: (A) OS curves of stage I GC patients. (B) DFS curves of stage I GC patients. (C) OS curves of stage II GC patients. (D) DFS curves of stage II GC patients. (E) OS curves of stage III GC patients. (F) DFS curves of stage III GC patients.