


Introduction
Gastric cancer (GC) is the sixth most common cancer and the second most common cause of cancer-related deaths worldwide [1]. Surgical intervention remains the only curative treatment for GC. Individuals between 50 and 70 years old show the most frequent GC prevalence.
A large series comparing the clinicopathological and molecular features between younger (<45 years) and older (≥45 years) GC patients [2] demonstrated that younger patients were associated with a female predominance and a more advanced stage, less frequent TP53 and HER-2 overexpression, fewer microsatellite instability-high (MSI-H) tumors, a higher level of Helicobacter pylori (HP) infection, and worse cancer-specific survival than older patients. Younger patients had higher cancer-related mortality than older patients.
To the best of our knowledge, few reports have compared the genetic mutations between younger and older GC patients. The incidence of TP53 mutations was reported to be different between younger and older GC patients [3]. In addition to GC, there is a lack of comprehensive and economic genetic analysis method for cancer-related genes that have been reported to differ between younger and older cancer patients in cancers related or non-related to the gastrointestinal tract. In colorectal cancer, loss of ARID1A expression was associated with a younger age [4]. In papillary thyroid carcinoma, patients with BRAF expression were associated with older age and higher tumor recurrence rates than patients without BRAF expression [5]. In endometrial carcinoma, PIK3CA amplifications, but not PIK3CA mutation, were associated with older age [6]. In breast cancer, PTEN mutations were associated with younger age [7].
According to the World Health Organization (WHO), most developed countries use a chronological age of 65 years or older to categorize elder or older persons. Therefore, in the present study, we separated patients into younger age (<65 years) and older age (≥65 years) groups. Since whole genome sequencing is expensive, we used mass spectrometric single nucleotide polymorphism genotyping technology for multiplex analysis, which included 68 validated mutations within eight genes (TP53, ARID1A, BRAF, and the PI3K/AKT pathway) [8] in accordance with previous data that mutations in these genes were shown for cancers related or non-related to the gastrointestinal tract. The aim of the present study was to compare the clinicopathological features, recurrence patterns, prognoses, and genetic alterations between younger and older GC patients with curative surgery.
Results
Clinicopathological features
As shown in Table 1, younger patients (<65 years) were more likely to be female, and have poor cell differentiation, diffuse-type tumors, and less lymphovascular invasion than older patients (≥65 years).
Table 1. Clinical profile in GC patients in different age groups.
| Variables | Age <65 years n=618 n (%) | Age ≥65 years n=1131 n (%) | P value | ||||||||||||||||||||||||||||||||||||||||||||||||||||||||||||||||||||||||||||||||||||||||||||||||
| Gender (M/F) | 341/277 | 914/217 | <0.001 | ||||||||||||||||||||||||||||||||||||||||||||||||||||||||||||||||||||||||||||||||||||||||||||||||
| Tumor size (<5/≥5 cm) | 368/250 | 631/500 | 0.129 | ||||||||||||||||||||||||||||||||||||||||||||||||||||||||||||||||||||||||||||||||||||||||||||||||
| Cell differentiation | <0.001 | ||||||||||||||||||||||||||||||||||||||||||||||||||||||||||||||||||||||||||||||||||||||||||||||||||
| Poor | 430 (69.6) | 450 (39.8) | |||||||||||||||||||||||||||||||||||||||||||||||||||||||||||||||||||||||||||||||||||||||||||||||||
| Moderate | 183 (29.6) | 657 (58.1) | |||||||||||||||||||||||||||||||||||||||||||||||||||||||||||||||||||||||||||||||||||||||||||||||||
| Well | 5 (0.8) | 24 (2.1) | |||||||||||||||||||||||||||||||||||||||||||||||||||||||||||||||||||||||||||||||||||||||||||||||||
| Gross appearance | <0.001 | ||||||||||||||||||||||||||||||||||||||||||||||||||||||||||||||||||||||||||||||||||||||||||||||||||
| Superficial type | 251 (40.6) | 400 (35.4) | |||||||||||||||||||||||||||||||||||||||||||||||||||||||||||||||||||||||||||||||||||||||||||||||||
| Borrmann type 1 and 2 | 109 (17.6) | 308 (27.2) | |||||||||||||||||||||||||||||||||||||||||||||||||||||||||||||||||||||||||||||||||||||||||||||||||
| Borrmann type 3 and 4 | 258 (41.7) | 423 (37.4) | |||||||||||||||||||||||||||||||||||||||||||||||||||||||||||||||||||||||||||||||||||||||||||||||||
| Lauren’s classification | <0.001 | ||||||||||||||||||||||||||||||||||||||||||||||||||||||||||||||||||||||||||||||||||||||||||||||||||
| Intestinal type | 235 (38.0) | 787 (69.6) | |||||||||||||||||||||||||||||||||||||||||||||||||||||||||||||||||||||||||||||||||||||||||||||||||
| Diffuse type | 383 (62.0) | 344 (30.4) | |||||||||||||||||||||||||||||||||||||||||||||||||||||||||||||||||||||||||||||||||||||||||||||||||
| Lymphovascular invasion | 302 (48.9) | 610 (53.9) | 0.043 | ||||||||||||||||||||||||||||||||||||||||||||||||||||||||||||||||||||||||||||||||||||||||||||||||
| Pathological T category | 0.090 | ||||||||||||||||||||||||||||||||||||||||||||||||||||||||||||||||||||||||||||||||||||||||||||||||||
| T1/2/3/4 | 224/80/231/83 | 386/188/383/174 | |||||||||||||||||||||||||||||||||||||||||||||||||||||||||||||||||||||||||||||||||||||||||||||||||
| Pathological N category | 0.524 | ||||||||||||||||||||||||||||||||||||||||||||||||||||||||||||||||||||||||||||||||||||||||||||||||||
| N0/1/2/3 | 281/91/95/151 | 552/145/170/264 | |||||||||||||||||||||||||||||||||||||||||||||||||||||||||||||||||||||||||||||||||||||||||||||||||
| Pathological TNM Stage | 0.447 | ||||||||||||||||||||||||||||||||||||||||||||||||||||||||||||||||||||||||||||||||||||||||||||||||||
| I/II/III | 243/152/223 | 471/250/410 | |||||||||||||||||||||||||||||||||||||||||||||||||||||||||||||||||||||||||||||||||||||||||||||||||
| TNM: Tumor, Node, Metastasis; Bold: statistically significant | |||||||||||||||||||||||||||||||||||||||||||||||||||||||||||||||||||||||||||||||||||||||||||||||||||
Initial recurrence patterns
As shown in Table 2, among the 1749 patients, younger patients tended to have fewer liver metastases than older patients.
Table 2. The initial recurrence pattern in gastric cancer patients in different age groups.
| Age <65 years n=618 n (%) | Age ≥65 years n=1131 n (%) | P value | |||||||||||||||||||||||||||||||||||||||||||||||||||||||||||||||||||||||||||||||||||||||||||||||||
| Total patients with recurrence | 119 (19.3) | 212 (18.7) | 0.794 | ||||||||||||||||||||||||||||||||||||||||||||||||||||||||||||||||||||||||||||||||||||||||||||||||
| Locoregional recurrence | 51 (8.3) | 84 (7.4) | 0.536 | ||||||||||||||||||||||||||||||||||||||||||||||||||||||||||||||||||||||||||||||||||||||||||||||||
| Distant metastasis | 94 (15.2) | 179 (15.8) | 0.734 | ||||||||||||||||||||||||||||||||||||||||||||||||||||||||||||||||||||||||||||||||||||||||||||||||
| Peritoneal dissemination | 54 (8.7) | 71 (6.3) | 0.056 | ||||||||||||||||||||||||||||||||||||||||||||||||||||||||||||||||||||||||||||||||||||||||||||||||
| Hematogenous metastasis | 39 (6.3) | 100 (8.8) | 0.061 | ||||||||||||||||||||||||||||||||||||||||||||||||||||||||||||||||||||||||||||||||||||||||||||||||
| Liver | 21 (3.4) | 73 (6.5) | 0.007 | ||||||||||||||||||||||||||||||||||||||||||||||||||||||||||||||||||||||||||||||||||||||||||||||||
| Lung | 7 (1.1) | 18 (1.6) | 0.440 | ||||||||||||||||||||||||||||||||||||||||||||||||||||||||||||||||||||||||||||||||||||||||||||||||
| Bone | 10 (1.6) | 12 (1.1) | 0.318 | ||||||||||||||||||||||||||||||||||||||||||||||||||||||||||||||||||||||||||||||||||||||||||||||||
| Brain | 3 (0.5) | 1 (0.1) | 0.097 | ||||||||||||||||||||||||||||||||||||||||||||||||||||||||||||||||||||||||||||||||||||||||||||||||
| Adrenal | 1 (0.2) | 3 (0.3) | 0.665 | ||||||||||||||||||||||||||||||||||||||||||||||||||||||||||||||||||||||||||||||||||||||||||||||||
| Skin | 2 (0.3) | 2 (0.2) | 0.539 | ||||||||||||||||||||||||||||||||||||||||||||||||||||||||||||||||||||||||||||||||||||||||||||||||
| Distant lymphatic recurrence | 18 (2.9) | 43 (3.8) | 0.333 | ||||||||||||||||||||||||||||||||||||||||||||||||||||||||||||||||||||||||||||||||||||||||||||||||
| Some patients had more than one recurrence patter; Bold: statistically significant | |||||||||||||||||||||||||||||||||||||||||||||||||||||||||||||||||||||||||||||||||||||||||||||||||||
Survival analysis
As shown in Figure 1, the 5-year overall survival (OS) (68.0% vs. 54.6%, P<0.001) and disease-free survival (DFS) (65.4% vs. 53.0%, P<0.001) rates were higher in younger patients than in older patients.
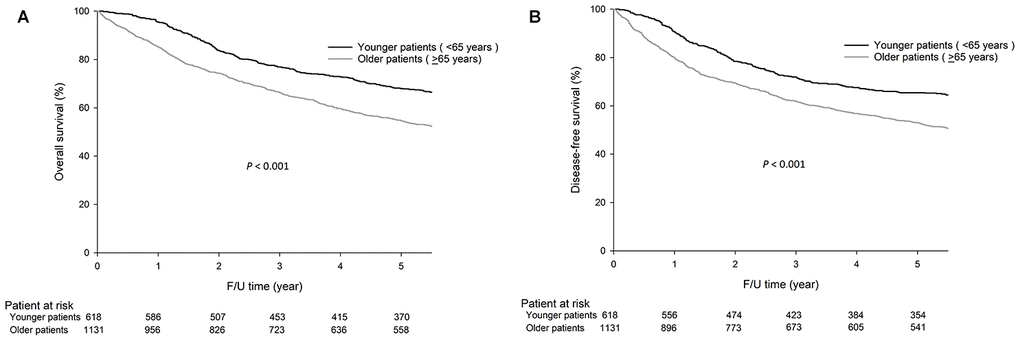
Figure 1. The 5-year OS (68.0% vs. 54.6%, P<0.001) and DFS (65.4% vs. 53.0%, P<0.001) rates were significantly higher in younger patients (<65 years) than in older patients (≥65 years). The survival curves are shown as follows: (A) OS curves of GC patients. (B) DFS curves of GC patients.
As shown in Figure 2, the OS and DFS rates were significantly higher in younger patients than in older patients for stage I GC (5-year OS, 94.9% vs. 78.2%, P<0.001, Figure 2A and DFS, 94.1% vs. 77.8%, P<0.001, Figure 2B); stage II GC (5-year OS, 75.9% vs. 60.6%, P<0.001, Figure 2C and DFS, 72.7% vs. 57.5%, P<0.001, Figure 2D); and stage III GC (5-year OS, 33.3% vs. 23.6%, P<0.001, Figure 2E and DFS, 29.1% vs. 21.4%, P=0.001, Figure 2F).
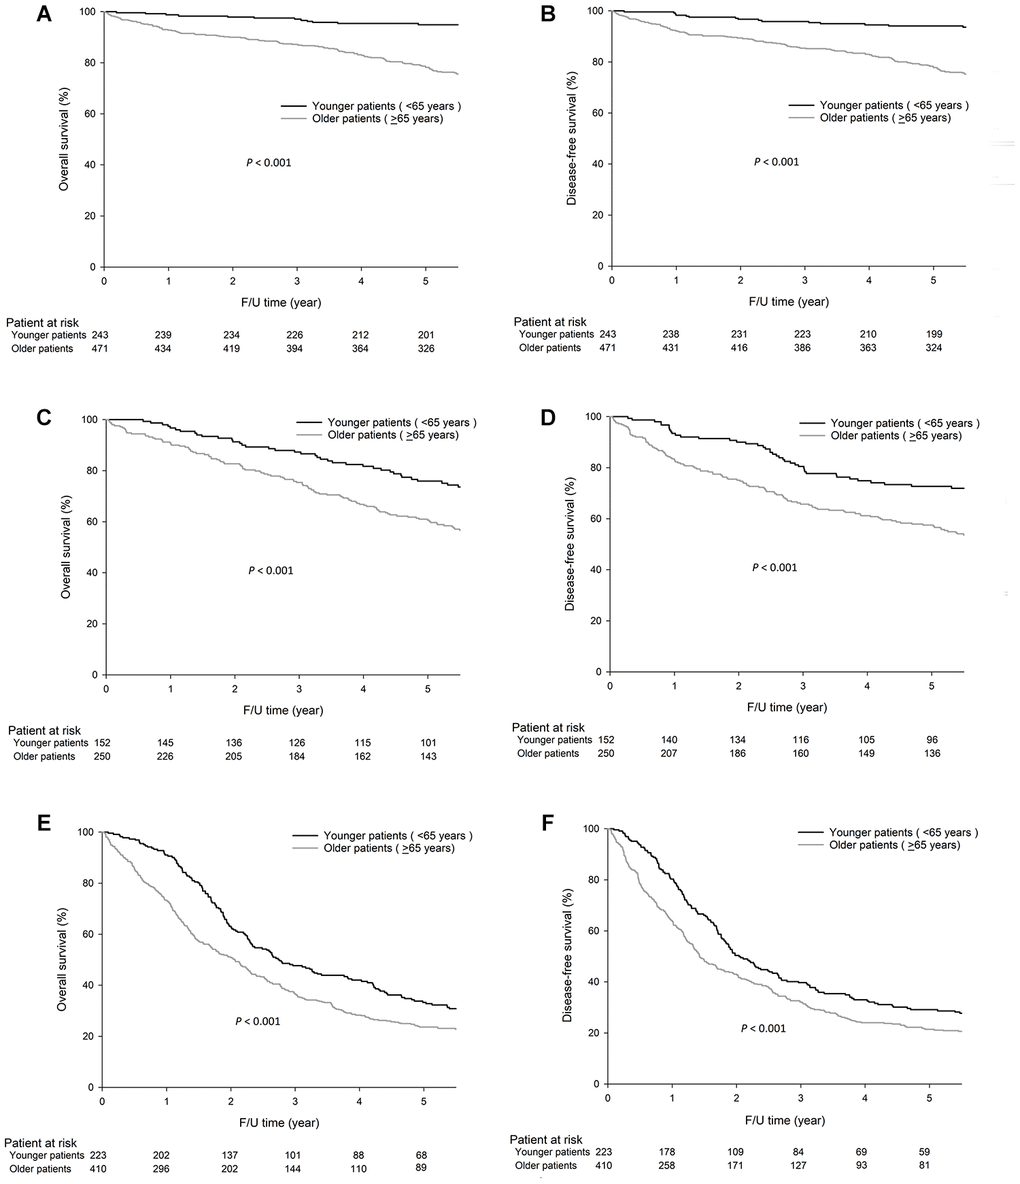
Figure 2. For stage I GC, the 5-year OS (94.9% vs. 78.2%, P<0.001) and DFS (94.1% vs. 77.8%, P<0.001) rates were significantly higher in younger patients (< 65 years) than older patients (≥65 years), and similar results were observed for stage II GC, the 5-year OS, 75.9% vs. 60.6%, P<0.001 and DFS, 72.7% vs. 57.5%, P<0.001) and stage III GC, 5-year OS, 33.3% vs. 23.6%, P<0.001 and DFS, 29.1% vs. 21.4%, P=0.001. The survival curves are shown as follows: (A) OS curves of stage I GC patients. (B) DFS curves of stage I GC patients. (C) OS curves of stage II GC patients. (D) DFS curves of stage II GC patients. (E) OS curves of stage III GC patients. (F) DFS curves of stage III GC patients.
The univariate analysis demonstrated that the following seven factors were associated with OS and DFS: age, gender, tumor size, cell differentiation, lymphovascular invasion, Lauren’s classification, and pathological Tumor, Node, Metastasis (TNM) stage (Table 3). The aforementioned seven variables were included in a multivariate Cox proportional hazards model to adjust for the effects of covariates. The multivariate analysis demonstrated that age, tumor size, and pathological TNM stage were independent prognostic factors affecting OS and DFS (Table 3).
Table 3. Univariate and multivariate analysis of factors affecting OS and DFS of GC patients after curative surgery.
| Prognostic factors | Univariate analysis | ||||||||||||||||||||||||||||||||||||||||||||||||||||||||||||||||||||||||||||||||||||||||||||||||||
| OS | DFS | ||||||||||||||||||||||||||||||||||||||||||||||||||||||||||||||||||||||||||||||||||||||||||||||||||
| HR | 95%CI | P value | HR | 95%CI | P value | ||||||||||||||||||||||||||||||||||||||||||||||||||||||||||||||||||||||||||||||||||||||||||||||
| Age | 1.46 | 1.135-1.878 | 0.003 | 1.40 | 1.095-1.795 | 0.007 | |||||||||||||||||||||||||||||||||||||||||||||||||||||||||||||||||||||||||||||||||||||||||||||
| Gender | 0.72 | 0.546-0.948 | 0.019 | 0.71 | 0.543-0.938 | 0.016 | |||||||||||||||||||||||||||||||||||||||||||||||||||||||||||||||||||||||||||||||||||||||||||||
| Tumor size | 2.44 | 1.850-3.227 | <0.001 | 2.41 | 1.835-3.168 | <0.001 | |||||||||||||||||||||||||||||||||||||||||||||||||||||||||||||||||||||||||||||||||||||||||||||
| Cell differentiation | 0.76 | 0.600-0.963 | 0.023 | 0.75 | 0.596-0.951 | 0.017 | |||||||||||||||||||||||||||||||||||||||||||||||||||||||||||||||||||||||||||||||||||||||||||||
| Lymphovascular invasion | 2.69 | 1.964-3.680 | <0.001 | 2.57 | 1.890-3.485 | <0.001 | |||||||||||||||||||||||||||||||||||||||||||||||||||||||||||||||||||||||||||||||||||||||||||||
| Lauren’s classification | 1.33 | 1.044-1.689 | 0.021 | 1.32 | 1.044-1.680 | 0.021 | |||||||||||||||||||||||||||||||||||||||||||||||||||||||||||||||||||||||||||||||||||||||||||||
| Adjuvant chemotherapy | 0.86 | 0.609-1.199 | 0.364 | 0.89 | 0.643-1.239 | 0.496 | |||||||||||||||||||||||||||||||||||||||||||||||||||||||||||||||||||||||||||||||||||||||||||||
| Pathological TNM stage | 2.52 | 2.125-2.981 | <0.001 | 2.33 | 1.985-2.735 | <0.001 | |||||||||||||||||||||||||||||||||||||||||||||||||||||||||||||||||||||||||||||||||||||||||||||
| Prognostic factors | Multivariate analysis | ||||||||||||||||||||||||||||||||||||||||||||||||||||||||||||||||||||||||||||||||||||||||||||||||||
| OS | DFS | ||||||||||||||||||||||||||||||||||||||||||||||||||||||||||||||||||||||||||||||||||||||||||||||||||
| HR | 95%CI | P value | HR | 95%CI | P value | ||||||||||||||||||||||||||||||||||||||||||||||||||||||||||||||||||||||||||||||||||||||||||||||
| Age | 1.47 | 1.126-1.920 | 0.005 | 1.39 | 1.071-1.808 | 0.013 | |||||||||||||||||||||||||||||||||||||||||||||||||||||||||||||||||||||||||||||||||||||||||||||
| Gender | 1.11 | 0.827-1.491 | 0.485 | 1.07 | 0.799-1.436 | 0.646 | |||||||||||||||||||||||||||||||||||||||||||||||||||||||||||||||||||||||||||||||||||||||||||||
| Tumor size | 1.43 | 1.066-1.929 | 0.017 | 1.46 | 1.086-1.951 | 0.012 | |||||||||||||||||||||||||||||||||||||||||||||||||||||||||||||||||||||||||||||||||||||||||||||
| Cell differentiation | 0.89 | 0.614-1.300 | 0.556 | 0.87 | 0.604-1.255 | 0.458 | |||||||||||||||||||||||||||||||||||||||||||||||||||||||||||||||||||||||||||||||||||||||||||||
| Lymphovascular invasion | 1.14 | 0.798-1.620 | 0.478 | 1.13 | 0.799-1.603 | 0.485 | |||||||||||||||||||||||||||||||||||||||||||||||||||||||||||||||||||||||||||||||||||||||||||||
| Lauren’s classification | 1.08 | 0.740-1.586 | 0.680 | 1.06 | 0.728-1.540 | 0.765 | |||||||||||||||||||||||||||||||||||||||||||||||||||||||||||||||||||||||||||||||||||||||||||||
| Pathological TNM stage | 2.29 | 1.868-2.809 | <0.001 | 2.10 | 1.729-2.552 | <0.001 | |||||||||||||||||||||||||||||||||||||||||||||||||||||||||||||||||||||||||||||||||||||||||||||
| CI: confidence interval; HR: hazard ratio; OS: overall survival; DFS: disease-free survival; TNM: Tumor, Node, Metastasis; Bold: statistically significant; | |||||||||||||||||||||||||||||||||||||||||||||||||||||||||||||||||||||||||||||||||||||||||||||||||||
Causes of death
Among the 1749 patients, 639 died before the last follow-up. The causes of death in younger patients included 28 (12.3%) non-cancer-related deaths, 190 (83.7%) GC-related deaths, and 9 (4.0%) other cancer-related deaths. The causes of death in older patients included 250 (36.2%) non-cancer-related deaths, 405 (58.7%) GC-related deaths, and 35 (5.1%) other cancer-related deaths. Older patients had significantly higher non-cancer-related death rates than younger patients (36.2% vs. 12.3%, P<0.001).
For stage I GC, older patients had a slightly higher non-cancer-related death rate than younger patients (60.7% vs. 42.9%, P=0.059). For stage II GC, older patients had a significantly higher non-cancer-related death rate than younger patients (39.7% vs. 10.6%, P=0.001), which was also observed in stage III GC (19.8% vs. 8.8%, P=0.006).
Analysis of genetic alterations
As shown in Table 4, older patients had more MSI-H tumors and ARID1A mutations than younger patients. Genetic mutations in the PI3K/AKT pathway, TP53, and BRAF were not significantly different between the age groups.
Table 4. Comparison of the molecular differences between different age groups.
| Variables | Age <65 years n=185 n (%) | Age ≥65 years n=248 n (%) | P value | ||||||||||||||||||||||||||||||||||||||||||||||||||||||||||||||||||||||||||||||||||||||||||||||||
| MSI status | 0.007 | ||||||||||||||||||||||||||||||||||||||||||||||||||||||||||||||||||||||||||||||||||||||||||||||||||
| MSI-H | 9 (4.9) | 31 (12.5) | |||||||||||||||||||||||||||||||||||||||||||||||||||||||||||||||||||||||||||||||||||||||||||||||||
| MSI-L/S | 176 (95.1) | 217 (87.5) | |||||||||||||||||||||||||||||||||||||||||||||||||||||||||||||||||||||||||||||||||||||||||||||||||
| HP infection | 105 (56.8) | 121 (48.8) | 0.101 | ||||||||||||||||||||||||||||||||||||||||||||||||||||||||||||||||||||||||||||||||||||||||||||||||
| EBV infection | 28 (15.1) | 29 (11.7) | 0.295 | ||||||||||||||||||||||||||||||||||||||||||||||||||||||||||||||||||||||||||||||||||||||||||||||||
| PIK3CA amplification | 60 (32.4) | 93 (37.5) | 0.275 | ||||||||||||||||||||||||||||||||||||||||||||||||||||||||||||||||||||||||||||||||||||||||||||||||
| Genetic mutations | |||||||||||||||||||||||||||||||||||||||||||||||||||||||||||||||||||||||||||||||||||||||||||||||||||
| PI3K/AKT pathway | 21 (11.4) | 36 (14.5) | 0.335 | ||||||||||||||||||||||||||||||||||||||||||||||||||||||||||||||||||||||||||||||||||||||||||||||||
| TP53 | 20 (10.8) | 27 (10.9) | 0.980 | ||||||||||||||||||||||||||||||||||||||||||||||||||||||||||||||||||||||||||||||||||||||||||||||||
| ARID1A | 9 (4.9) | 27 (10.9) | 0.025 | ||||||||||||||||||||||||||||||||||||||||||||||||||||||||||||||||||||||||||||||||||||||||||||||||
| BRAF | 0 | 1 (0.4) | 0.387 | ||||||||||||||||||||||||||||||||||||||||||||||||||||||||||||||||||||||||||||||||||||||||||||||||
| MSI: microsatellite instability; MSI-H: MSI-high; MSI-L/S: MSI-low/stable; HP: Helicobacter pylori; EBV: Epstein-Barr virus; Bold: statistically significant | |||||||||||||||||||||||||||||||||||||||||||||||||||||||||||||||||||||||||||||||||||||||||||||||||||
Regarding the genetic mutations in the PI3K/AKT pathway, the frequencies of each mutated gene between younger and older patients were as follows: PIK3CA (7.6% vs. 9.7%, P=0.443), PTEN (3.2% vs. 4.4%, P=0.527), AKT1 (0.5% vs. 0%, P=0.246), AKT2 (0% vs. 0.4%, P=0.387), AKT3 (0% vs. 0.8%, P=0.221), respectively.
Analysis of the differences in clinicopathological features, patient prognosis, and genetic alterations between three different age groups
Because individuals between 50 and 70 years old show the most frequent GC prevalence, patients between 50 and 70 years may share the same disease characteristics, pathogenesis and clinicopathological characteristics. In addition, age is better appreciated as a continuous variable and variation exists in individuals of the same age, and any predefined age cut-off is an arbitrary rather than an unequivocal definition, however, several reasons led majority individual studies and international groups to define patients younger than 40 years old as younger patients [9]. Moreover, the number of patients younger than 40 years old is only 57 in the present study, showing that 40 years old is not appropriate to be the cut-off point of age due to disparity. According to the above reasons, we separate the enrolled patients into three age groups: group 1: age <50 years; group 2: age 50-70 years; and group 3: age >70 years.
As shown in Supplementary Table 1, group 1 was more likely to be female and have poor cell differentiation, superficial-type tumors, diffuse-type tumors, and less lymphovascular invasion than groups 2 and 3. Regarding the initial recurrence patterns, as shown in Supplementary Table 2, among the 1749 patients, those in group 1 tended to have fewer hematogenous and liver metastases than those in groups 2 and 3.
As shown in Supplementary Figure 1, the 5-year OS rates (74.4% vs. 63.3% vs. 53.3%, P<0.001) and DFS rates (70.8% vs. 61.3% vs. 51.7%, P<0.001) were higher in group 1 than in groups 2 and 3. As shown in Supplementary Figure 2A, for stage I GC, the 5-year OS (94.1% vs. 93.2% vs. 76.1%, P<0.001) and DFS (93.0% vs. 92.9% vs. 75.6%, P<0.001) rates were significantly higher in groups 1 and 2 than in group 3. For stage II GC (Supplementary Figure 2B), the 5-year OS (80.1% vs. 72.8% vs. 57.8%, P<0.001) and DFS (77.1% vs. 68.5% vs. 55.4%, P<0.001) rates were significantly higher in group 1 than in groups 2 and 3. For stage III GC, the 5-year OS (43.9% vs. 25.6% vs. 24.5%, P<0.001) and DFS (36.7% vs. 23.3% vs. 22.1%, P=0.003) rates were significantly higher in group 1 than in groups 2 and 3.
The univariate analysis demonstrated that the following seven factors were associated with OS and DFS: age, gender, tumor size, cell differentiation, lymphovascular invasion, Lauren’s classification, and pathological TNM stage. The aforementioned seven variables were included in a multivariate Cox proportional hazards model to adjust for the effects of covariates. The multivariate analysis demonstrated that age, gender, tumor size, lymphovascular invasion, and pathological TNM stage were independent prognostic factors affecting OS and DFS (Supplementary Table 3).
As shown in Supplementary Table 4, group 3 had more MSI-H tumors (group 1: 1.6%, group 2: 9.6%, group 3: 12.6%, respectively, P=0.038) and more ARID1A mutations (group 1: 3.2%, group 2: 7.4%, group 3: 11.0%, respectively, P=0.044) than groups 1 and 2. The genetic mutations in the PI3K/AKT pathway, TP53, and BRAF were not significantly different between different age groups. Regarding the genetic mutations in the PI3K/AKT pathway, the frequencies of each mutated gene between groups 1, 2, and 3 were as follows: PIK3CA (11.1% vs. 7.4% vs. 9.3%, P=0.632), PTEN (4.8% vs. 2.1% vs. 5.5%, P=0.411), AKT1 (0% vs. 0.5% vs. 0%, P=0.695), AKT2 (0% vs. 0.5% vs. 0%, P=0.695), AKT3 (0% vs. 0.5% vs. 0.5%, P=0.649), respectively.
Discussion
For GC patients with curative surgery, our results showed that older patients had worse survival outcomes than younger patients; similar results were also obtained at each TNM stage. Age itself is an independent prognostic factor. Older patients had more liver metastasis than younger patients. Regarding the molecular analysis, older patients had more MSI-H tumors and ARID1A mutations than younger patients. Our novel findings demonstrated that the modular differences varied between younger and older patients.
A large series demonstrated that young-onset GC patients had more advanced disease than older-onset GC patients, and age was not an independent prognostic factor [2]. However, in the present study, tumor stage was not significantly different between younger and older patients for all enrolled patients. Younger patients might have had better survival outcomes than older patients because they had relatively better health conditions and were more willing to undergo and could better tolerate adjuvant chemotherapy. The percentage of GC patients receiving adjuvant chemotherapy was significantly higher among younger patients (18.9%) than older patients (8.4%). The low percentage of adjuvant chemotherapy in our patient population occurred because adjuvant chemotherapy was not routinely performed before 2008, after which time it was shown to have a survival benefit [10]. Although adjuvant chemotherapy was not associated with patient survival in the present study, the increase in the initial recurrence pattern in older patients may be associated with less use of chemotherapy than in younger patients. In addition, younger patients might have received more aggressive chemotherapy than older patients; however, this hypothesis was not tested because the detailed chemotherapy regimens for each patient were not available in our database. In the present study, older patients had a significantly higher non-cancer-related death rate than younger patients (36.2% vs. 12.3%, P<0.001), which was similar to the findings of Seo et al [2]. Consequently, another reason why older patients had a worse survival rate than younger patients may be due to the increased amount of non-cancer-related deaths among older patients.
For clinical use and economic concerns, we used mass spectrometric SNP genotyping technology for mutational analysis in the present study. However, integrating multiplatform genomic features is currently quite popular for cancer studies. Vertical integration of multidimensional omics data is indispensable to determine a subset of important prognostic features, such as cancer phenotype, cancer status, and patient survival [11]. Our future study will focus on integrating multiplatform genomic analysis, and we believe that integration studies on multi-omics data will provide insights into investigating novel biomarkers for cancer treatment.
Our results showed no significant difference in TP53 mutations between younger and older patients, which was inconsistent with the findings of Rahman et al [3], who demonstrated more TP53 mutations in younger patients than older patients. Rahman et al reported a relatively higher incidence of HP infection (51/71, 71.8%) and TP53 mutation (52/71, 73.2%) in their patient group than the present study, and a significant correlation between HP infection and TP53 mutation was observed. In their study, 63.4% of patients were smokers, and 75% of these patients had TP53 mutations. In addition, some patients had a routine habit of consuming excess salt in their daily meals. A high salt diet and HP infection have been associated with the development of GC [12, 13]. Furthermore, smoking was reported to be associated with TP53 mutation [14]. The incidence of TP53 mutation in patients younger than 40 years was 94.4% [3], while no patients with TP53 mutation were observed among patients in our study who were younger than 40 years. The discrepancy in TP53 mutations between the present study and the study by Rahman et al [3] might be due to differences in the incidence of HP infection and the smoking and eating habits, which are considered to be the environmental factors.
The novel finding of the present study is that older patients had more ARID1A mutations than younger patients, which has not previously been reported. Even though we divided the patients into three age groups, the frequency of ARID1A mutations increased significantly with age. In colorectal cancer, loss of ARID1A expression was associated with younger age [4]. ARID1A is identified as a tumor suppressor gene in various cancers, especially gynecologic cancers, and an inverse correlation between ARID1A expression and tumor stage has been reported [15–17]. In the present study, patients with ARID1A mutations had significantly more MSI-H tumors than patients without ARID1A mutations (25% vs. 7.8%, P=0.001), which was similar to the results of other studies [18]. As a result, our older patients had more MSI-H tumors than younger patients, which may lead to a higher frequency of ARID1A mutations in older patients.
Environmental factors such as HP infection and dietary and smoking habits are known to impact the histologic type and genetic alterations during gastric carcinogenesis. Patients with HP infection were more likely to have KRAS mutation than patients without HP infection [19]. Another environmental factor, such as EBV infection, was reported to be associated with genetic mutations (AKT2, CCNA1, MAP3K4, and TGFBR1) and hypermethylation (ACSS1, FAM3B, IHH, and TRABD) in GC tissues; AKT2 mutation was associated with a poor survival in GC patients with EBV infection [20]. Age might be treated as an environmental factor that is correlated with the gene-environment interactions, resulting in an association between age and clinicopathological and molecular features.
There are some limitations in the present study. First, this is a retrospective study and selection bias exists. Second, not all enrolled patients had available tumor samples for the analysis of genetic alterations. Third, younger patients with more advanced disease and older patients with poor physical conditions are all not candidates for surgery, excluding these patients may severely biased the assessment of effect of age on GC patients. Although the authors only want to study on patients with curative GC, these patients were firstly selected based on conditions suitable for surgery, age is less important in these patients than in all GC patients, which can help to guide prevention, prediction, prognosis and treatment. Forth, this study included patients hospitalized from 1998-2013, in which period the treatments of GC, such as adjuvant therapy, perioperative therapy, D2 gastrectomy, minimally invasive surgery, endoscopic therapy and targeted therapy, all are inconsistent between the patients and may affect prognosis. Fifth, according to The Cancer Genome Atlas (TCGA) dataset [21], the mutation frequencies of AKT1 (0.9%), AKT2 (2.3%), AKT3 (1.8%) and BRAF (3.0%) are very low. Although we don't know which of them are driver genes and which of them are passenger genes, the test power is too weak to make a meaningful outcome when to compare their differences.
In conclusion, age was associated with clinicopathological features, recurrence patterns, patient prognoses and genetic alterations in GC with curative surgery. Our findings might be advanced by investigating gene-environment interactions while treating age as an environmental factor.
Materials and Methods
Patients and sample collection
A total of 1749 patients who underwent curative surgery for gastric adenocarcinoma between 1998 and 2013 were enrolled. Patients who had gastric stump cancer or a history of previous gastric surgery were excluded.
A total of 433 patients with available tissues were enrolled to analyze genetic alterations. Tumor tissues and normal gastric mucosa tissues were collected and stored in a biobank at our institution. The study was approved by the Ethical Committee of Taipei Veterans General Hospital and was performed in accordance with the Declaration of Helsinki. Written informed consent was obtained from all study participants. The pathological staging of GC was performed according to the 8th American Joint Committee on Cancer (AJCC)/Union for International Cancer Control (UICC) TNM classification system [22].
Follow-up
Follow-up examinations were performed every 3 months during the first 3 years after surgery and every 6 months thereafter and included physical examinations, blood tests with measurements of tumor markers, chest radiography, and sonography or computerized tomography scans of the abdomen.
Adjuvant chemotherapy after curative surgery was not routinely performed in our institute prior to 2008; these treatments were applied only when tumor recurrence was diagnosed or highly suspected. TS-1 adjuvant chemotherapy was started for stage II and III patients in 2008 due to its proven survival benefits [9].
DNA extraction
DNA extraction from tissue specimens was performed using the QIAamp DNA Tissue Kit and MinElute Virus Kit (Qiagen, Valencia, CA) according to a previous report [8].
Detection of HP and Epstein-Barr virus (EBV) infection
Both tumor and nontumor tissues were assessed for HP infection with the polymerase chain reaction (PCR) method. The sequence of the HP reference genome (GenBank: AE000511.1) was used recording to a previous report [23].
EBV DNA assays were carried out using the Sequenom MassARRAY system (Sequenom, San Diego, CA) according to a previous report [23].
MSI analysis
As described in a previous study [24], five reference microsatellite markers, namely, D5S345, D2S123, D17S250, BAT25 and BAT26, were used to determine the presence of MSI. MSI-H was defined as ≥ 2 loci of instability with 5 markers, while MSI-low/stable (MSI-L/S) was defined as one locus or no MSI loci.
MassARRAY-based mutation characterization
A MassARRAY system (Agena, San Diego, CA) was used to identify 68 mutation hotspots in 8 GC-related genes (TP53, ARID1A, PTEN, PIK3CA, AKT1, AKT2, AKT3, and BRAF) [8]. PI3K/AKT pathway genetic mutations were defined as mutations identified in PIK3CA, PTEN, AKT1, AKT2, or AKT3.
Statistical analysis
IBM SPSS Statistics 25.0 was used for statistical analyses. A χ2 test with Yates correction or Fisher’s exact test was used to compare categorical data. OS was defined from the date of surgery to the date of death or the last follow-up, while DFS was defined as the length of time after surgery during which the patient was alive without GC recurrence. The Kaplan–Meier method was used to perform the survival analysis and draw survival curves of OS and DFS. A multivariate analysis with Cox proportional hazards models was performed to analyze the independent prognostic factors of OS and DFS. A P value <0.05 was defined as statistically significant.
Abbreviations
AJCC: American Joint Committee on Cancer; DFS: Disease-free survival; EBV: Epstein-Barr virus; GC: Gastric cancer; HP: Helicobacter pylori; MSI: Microsatellite instability; MSI-H: Microsatellite instability-high; MSI-L/S: Microsatellite instability-low/stable; OS: Overall survival; PCR: Polymerase chain reaction; TCGA: The Cancer Genome Atlas; UICC: Union for International Cancer Control.
Author Contributions
Wen-Liang Fang carried out the statistical analysis and drafted the manuscript. Chien-Hsing Lin carried out the molecular genetic studies, including the MassARRAY analysis. Wen-Liang Fang and Kuo-Hung Huang collected patients’ records and samples. Wen-Liang Fang conceived of the study and participated in its design and coordination as well as complete drafting of the manuscript. All authors read and approved the final manuscript.
Acknowledgments
The authors thank Chien-Hsing Lin and Fang-Yu Chang for the molecular genetic analysis in the study.
Conflicts of Interest
No authors have any conflict of interest in relation to the manuscript.
Funding
This study was supported by the grants from the Ministry of Science and Technology, Taiwan (107-2314-B-075 -007). The funding sources had no role in the study design, data analysis, writing or submission of the manuscript.
References
- 1. Ferlay J, Colombet M, Soerjomataram I, Mathers C, Parkin DM, Piñeros M, Znaor A, Bray F. Estimating the global cancer incidence and mortality in 2018: GLOBOCAN sources and methods. Int J Cancer. 2019; 144:1941–53. https://doi.org/10.1002/ijc.31937 [PubMed]
- 2. Seo JY, Jin EH, Jo HJ, Yoon H, Shin CM, Park YS, Kim N, Jung HC, Lee DH. Clinicopathologic and molecular features associated with patient age in gastric cancer. World J Gastroenterol. 2015; 21:6905–13. https://doi.org/10.3748/wjg.v21.i22.6905 [PubMed]
- 3. Rahman MM, Sarker MA, Hossain MM, Alam MS, Islam MM, Shirin L, Sultana R, Sultana GN. Association of p53 gene mutation with Helicobacter pylori infection in gastric cancer patients and its correlation with clinicopathological and environmental factors. World J Oncol. 2019; 10:46–54. https://doi.org/10.14740/wjon1087 [PubMed]
- 4. Kishida Y, Oishi T, Sugino T, Shiomi A, Urakami K, Kusuhara M, Yamaguchi K, Kitagawa Y, Ono H. Associations between loss of ARID1A expression and clinicopathologic and genetic variables in T1 early colorectal cancer. Am J Clin Pathol. 2019; 152:463–70. https://doi.org/10.1093/ajcp/aqz062 [PubMed]
- 5. Fraser S, Go C, Aniss A, Sidhu S, Delbridge L, Learoyd D, Clifton-Bligh R, Tacon L, Tsang V, Robinson B, Gill AJ, Sywak M. BRAF(V600E) mutation is associated with decreased disease-free survival in papillary thyroid cancer. World J Surg. 2016; 40:1618–24. https://doi.org/10.1007/s00268-016-3534-x [PubMed]
- 6. Konopka B, Janiec-Jankowska A, Kwiatkowska E, Najmoła U, Bidziński M, Olszewski W, Goluda C. PIK3CA mutations and amplification in endometrioid endometrial carcinomas: relation to other genetic defects and clinicopathologic status of the tumors. Hum Pathol. 2011; 42:1710–19. https://doi.org/10.1016/j.humpath.2010.01.030 [PubMed]
- 7. Momozawa Y, Iwasaki Y, Parsons MT, Kamatani Y, Takahashi A, Tamura C, Katagiri T, Yoshida T, Nakamura S, Sugano K, Miki Y, Hirata M, Matsuda K, et al. Germline pathogenic variants of 11 breast cancer genes in 7,051 Japanese patients and 11,241 controls. Nat Commun. 2018; 9:4083. https://doi.org/10.1038/s41467-018-06581-8 [PubMed]
- 8. Fang WL, Lan YT, Huang KH, Liu CA, Hung YP, Lin CH, Jhang FY, Chang SC, Chen MH, Chao Y, Lin WC, Lo SS, Fen-Yau Li A, et al. Clinical significance of circulating plasma DNA in gastric cancer. Int J Cancer. 2016; 138:2974–83. https://doi.org/10.1002/ijc.30018 [PubMed]
- 9. Li J. Gastric cancer in young adults: a different clinical entity from carcinogenesis to prognosis. Gastroenterol Res Pract. 2020; 2020:9512707. https://doi.org/10.1155/2020/9512707 [PubMed]
- 10. Sakuramoto S, Sasako M, Yamaguchi T, Kinoshita T, Fujii M, Nashimoto A, Furukawa H, Nakajima T, Ohashi Y, Imamura H, Higashino M, Yamamura Y, Kurita A, Arai K, and ACTS-GC Group. Adjuvant chemotherapy for gastric cancer with S-1, an oral fluoropyrimidine. N Engl J Med. 2007; 357:1810–20. https://doi.org/10.1056/NEJMoa072252 [PubMed]
- 11. Wu C, Zhou F, Ren J, Li X, Jiang Y, Ma S. A selective review of multi-level omics data integration using variable selection. High Throughput. 2019; 8:4. https://doi.org/10.3390/ht8010004 [PubMed]
- 12. Shikata K, Kiyohara Y, Kubo M, Yonemoto K, Ninomiya T, Shirota T, Tanizaki Y, Doi Y, Tanaka K, Oishi Y, Matsumoto T, Iida M. A prospective study of dietary salt intake and gastric cancer incidence in a defined Japanese population: the hisayama study. Int J Cancer. 2006; 119:196–201. https://doi.org/10.1002/ijc.21822 [PubMed]
- 13. Lazarevic K, Nagorni A, Rancic N, Milutinovic S, Stosic L, Ilijev I. Dietary factors and gastric cancer risk: hospital-based case control study. J BUON. 2010; 15:89–93. [PubMed]
- 14. Ronchetti D, Neglia CB, Cesana BM, Carboni N, Neri A, Pruneri G, Pignataro L. Association between p53 gene mutations and tobacco and alcohol exposure in laryngeal squamous cell carcinoma. Arch Otolaryngol Head Neck Surg. 2004; 130:303–06. https://doi.org/10.1001/archotol.130.3.303 [PubMed]
- 15. Wu JN, Roberts CW. ARID1A mutations in cancer: another epigenetic tumor suppressor? Cancer Discov. 2013; 3:35–43. https://doi.org/10.1158/2159-8290.CD-12-0361 [PubMed]
- 16. Ayhan A, Mao TL, Seckin T, Wu CH, Guan B, Ogawa H, Futagami M, Mizukami H, Yokoyama Y, Kurman RJ, Shih IM. Loss of ARID1A expression is an early molecular event in tumor progression from ovarian endometriotic cyst to clear cell and endometrioid carcinoma. Int J Gynecol Cancer. 2012; 22:1310–15. [PubMed]
- 17. Guan B, Mao TL, Panuganti PK, Kuhn E, Kurman RJ, Maeda D, Chen E, Jeng YM, Wang TL, Shih IM. Mutation and loss of expression of ARID1A in uterine low-grade endometrioid carcinoma. Am J Surg Pathol. 2011; 35:625–32. https://doi.org/10.1097/PAS.0b013e318212782a [PubMed]
- 18. Kim YS, Jeong H, Choi JW, Oh HE, Lee JH. Unique characteristics of ARID1A mutation and protein level in gastric and colorectal cancer: a meta-analysis. Saudi J Gastroenterol. 2017; 23:268–74. https://doi.org/10.4103/sjg.SJG_184_17 [PubMed]
- 19. Jabini R, Eghbali SA, Ayatollahi H, Sheikhi M, Farzanehfar M. Analysis of KRAS gene mutation associated with Helicobacter pylori infection in patients with gastric cancer. Iran J Basic Med Sci. 2019; 22:529–33. https://doi.org/10.22038/ijbms.2019.32047.7707 [PubMed]
- 20. Liang Q, Yao X, Tang S, Zhang J, Yau TO, Li X, Tang CM, Kang W, Lung RW, Li JW, Chan TF, Xing R, Lu Y, et al. Integrative identification of epstein-barr virus-associated mutations and epigenetic alterations in gastric cancer. Gastroenterology. 2014; 147:1350–62.e4. https://doi.org/10.1053/j.gastro.2014.08.036 [PubMed]
- 21. Cancer Genome Atlas Research Network. Comprehensive molecular characterization of gastric adenocarcinoma. Nature. 2014; 513:202–09. https://doi.org/10.1038/nature13480 [PubMed]
- 22. Matos LL, Dedivitis RA, Kulcsar MA, de Mello ES, Alves VA, Cernea CR. External validation of the AJCC cancer staging manual, 8th edition, in an independent cohort of oral cancer patients. Oral Oncol. 2017; 71:47–53. https://doi.org/10.1016/j.oraloncology.2017.05.020 [PubMed]
- 23. Fang WL, Huang KH, Chang SC, Lin CH, Chen MH, Chao Y, Lo SS, Li AF, Wu CW, Shyr YM. Comparison of the clinicopathological characteristics and genetic alterations between patients with gastric cancer with or without Helicobacter pylori infection. Oncologist. 2019; 24:e845–53. https://doi.org/10.1634/theoncologist.2018-0742 [PubMed]
- 24. Fang WL, Chang SC, Lan YT, Huang KH, Chen JH, Lo SS, Hsieh MC, Li AF, Wu CW, Chiou SH. Microsatellite instability is associated with a better prognosis for gastric cancer patients after curative surgery. World J Surg. 2012; 36:2131–38. https://doi.org/10.1007/s00268-012-1652-7 [PubMed]