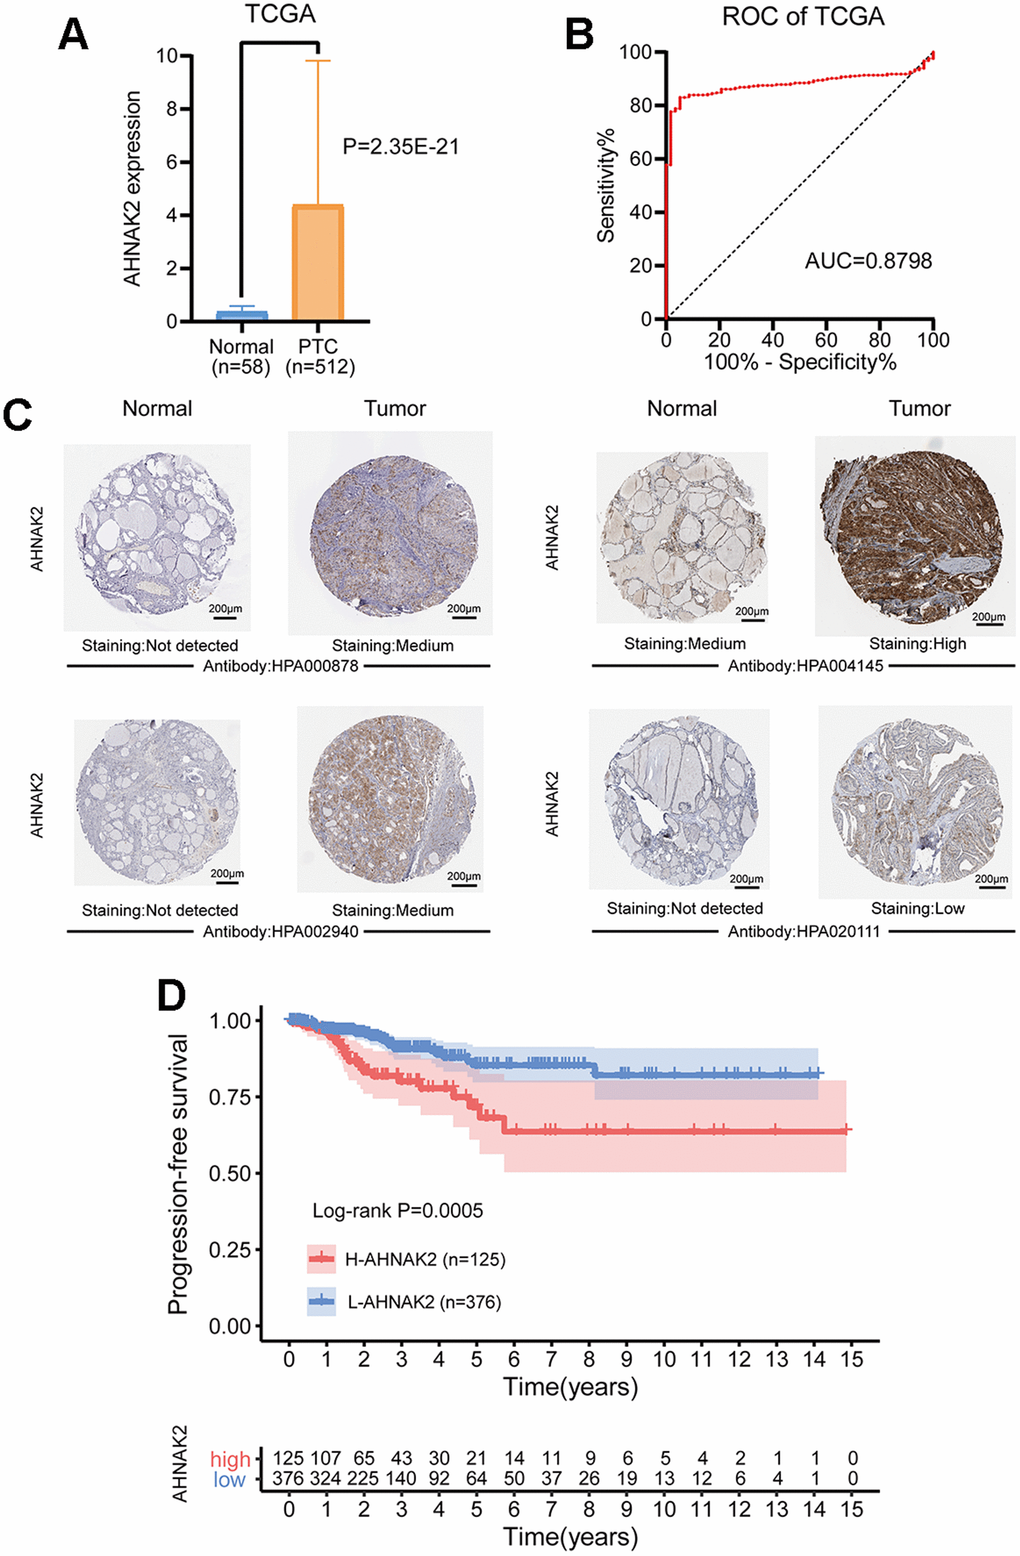
Figure 1.Diagnostic and prognostic value of AHNAK2 in PTC. (A) Comparison of AHNAK2 mRNA expression levels between PTC and normal tissues. (B) Diagnostic efficacy of the ROC curve of AHNAK2. (C) Comparison of immunohistochemistry images of AHNAK2 between PTC and normal thyroid tissues with four different AHNAK2 antibodies (HPA000878, HPA004145, HPA002940 and HPA020111) based on the Human Protein Atlas. (D) K-M survival analysis was performed to determine differences in PFS between the H-AHNAK2 and L-AHNAK2 groups.