


Introduction
Thyroid cancer (TC) is the fifth most common cancer among women in the United States, with an estimated 52,890 new TC cases nationwide in 2020 [1], and its incidence is increasing [2, 3]. Papillary thyroid carcinoma (PTC) is the most common subtype of TC, comprising approximately 80-85% of all TCs [4, 5]. Although most well-differentiated PTC patients have an excellent overall prognosis (the 5-year survival rate of such patients is greater than 97%) [4], PTC recurrence and metastasis still hinder clinical management and prognosis in certain patients. A study with a median follow-up of 27 years also reported that 28% of PTC patients had recurrent disease, and 9% of patients died from PTC [6]. Additionally, overdiagnosis and overtreatment are common problems associated with indolent diseases. The screening and identification of indolent TC and the treatment of these overdiagnosed cancers can increase the risk of injury to patients [7, 8]. Therefore, the use of novel and sensitive biomarkers to effectively identify specific PTC patients and provide personalized treatment has become an urgent need.
AHNAK nucleoprotein 2 (AHNAK2) is a giant protein (600 kDa) with a PDZ domain that was first detected in 2004 [9, 10]. AHNAK2 was recently reported as a biomarker for the diagnosis and prognosis of pancreatic ductal adenocarcinoma (PDAC) [11–13], clear cell renal cell carcinoma (ccRCC) [14], thymic carcinoma [15], bladder cancer [16], gastric cancer [17], and uveal melanoma (UM) [18]. Although the biological function of AHNAK2 in cancer remains unclear, some progress has been made regarding its mechanism in tumors. AHNAK2 is a critical element of the stress-induced FGF1 export pathway [19]. Li et al. [18] reported that AHNAK2 may play a role in promoting the proliferation and migration of UM cells by regulating the PI3K signaling pathway. Wang et al. [14] also found that AHNAK2 is a target gene of HIF1α, which mediates epithelial-mesenchymal transition (EMT) and stem cell characteristics driven by the hypoxia pathway, thereby promoting the progression of ccRCC.
The purpose of this study was to explore the clinical value and potential mechanism of AHNAK2 in PTC. Based on the bioinformatics method, we conducted a systematic multiomics study of AHNAK2 in PTC. Multiomics single-gene studies on the candidate oncogene AHNAK2 have enriched our understanding of the molecular function of AHNAK2 and have provided a new piece of the puzzle to the mechanism of cancer development and a basis for subsequent research on AHNAK2. The significant diagnostic and prognostic value of AHNAK2 may also be used in clinical practice to assist doctors in the diagnosis and treatment of PTC patients.
Results
Diagnostic value of AHNAK2
The mRNA expression level of AHNAK2 was significantly higher in PTC tissues than in normal tissues (P<0.0001) (Figure 1A). By performing receiver operating characteristic (ROC) curve analysis to discriminate PTC from normal thyroid tissues, we found that the area under the curve (AUC) of the AHNAK2 expression level was 0.88, suggesting that it could be a good diagnostic biomarker (Figure 1B).
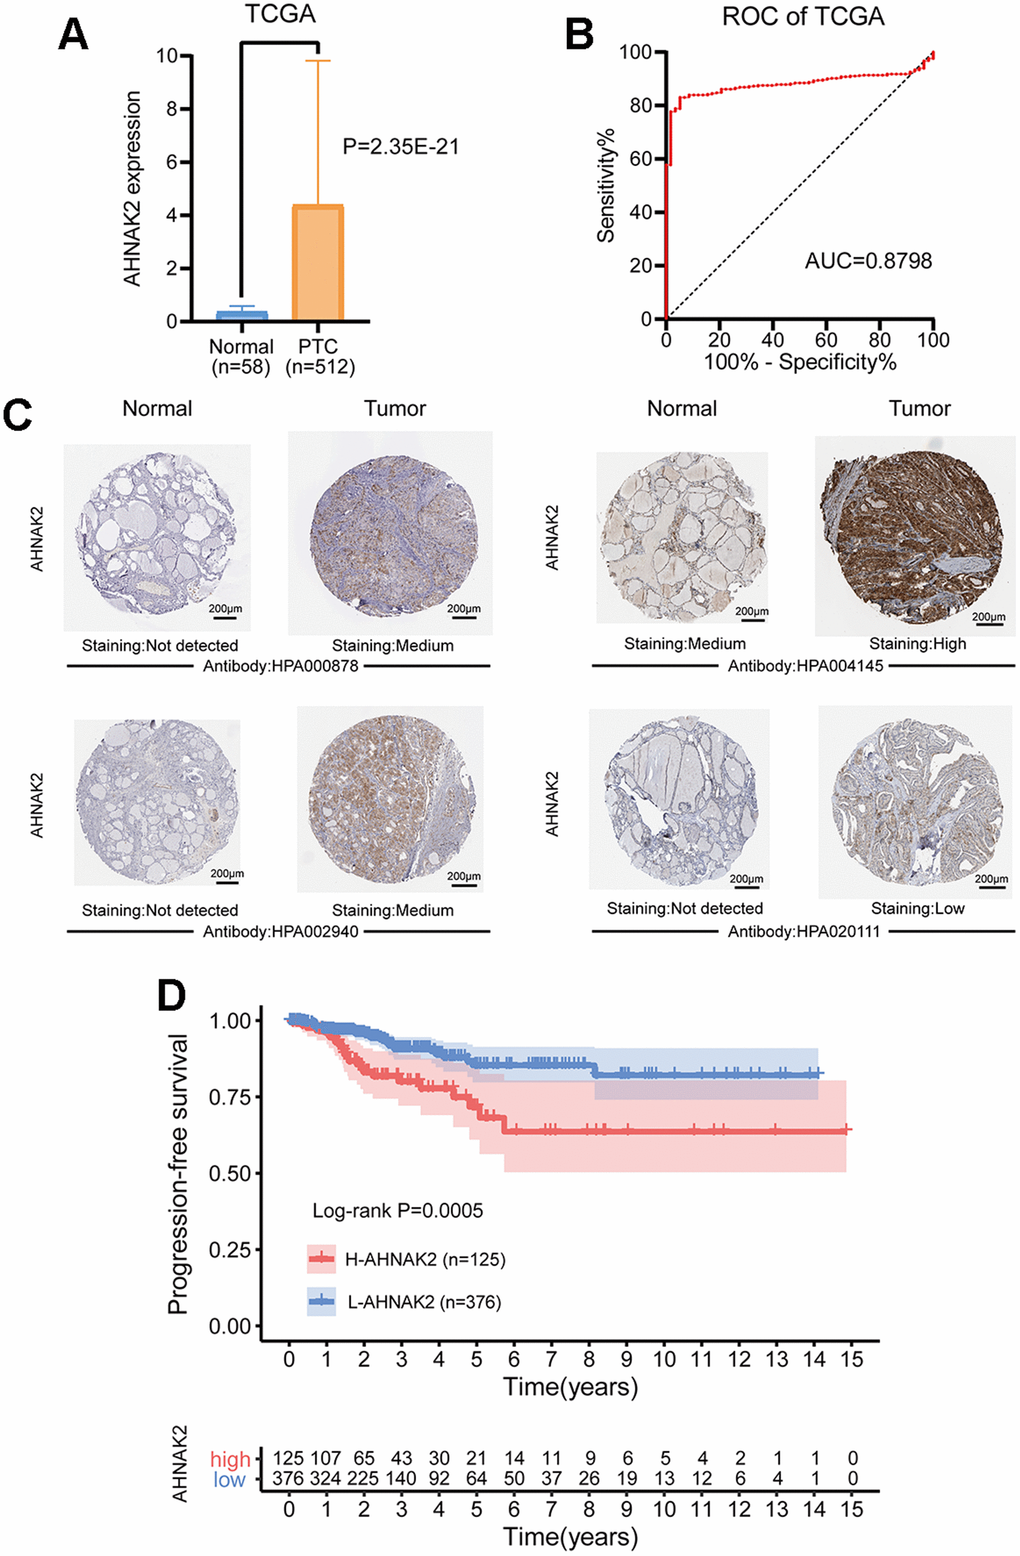
Figure 1. Diagnostic and prognostic value of AHNAK2 in PTC. (A) Comparison of AHNAK2 mRNA expression levels between PTC and normal tissues. (B) Diagnostic efficacy of the ROC curve of AHNAK2. (C) Comparison of immunohistochemistry images of AHNAK2 between PTC and normal thyroid tissues with four different AHNAK2 antibodies (HPA000878, HPA004145, HPA002940 and HPA020111) based on the Human Protein Atlas. (D) K-M survival analysis was performed to determine differences in PFS between the H-AHNAK2 and L-AHNAK2 groups.
Additionally, immunohistochemistry performed with four different AHNAK2 antibodies showed deeper staining levels in PTC tissues than in normal thyroid tissues, suggesting higher protein expression in PTC (Figure 1C).
Prognostic value of AHNAK2
Kaplan-Meier (K-M) survival analysis showed that the high AHNAK2 (H-AHNAK2) group was associated with worse progression-free survival (PFS) than the low AHNAK2 (L-AHNAK2) group (P=0.0005) (Figure 1D). Multivariate Cox regression analysis suggested that AHNAK2 could become an independent predictor after adjusting for other parameters, including age, gender, American Joint Committee on Cancer (AJCC) stage, BRAF mutations, RAS mutations and tumor mutation burden (TMB) (Table 1) (PFS as the ending indicator). In summary, AHNAK2 could be an important tool for distinguishing PTC patient clinical outcomes.
Table 1. Univariate and multivariate regression analyses of PTC.
| Variables | Univariate analysis | Multivariate analysis | ||
| Hazard ratio (95%CI) | P value | Hazard ratio (95%CI) | P value | |
| Age | 1.035(1.017−1.053) | <0.001 | 1.020(0.994−1.046) | 0.132 |
| Gender (male/female) | 1.398(0.771−2.536) | 0.270 | 1.256(0.676−2.335) | 0.471 |
| Stage | 1.739(1.367−2.212) | <0.001 | 1.402(1.027−1.915) | 0.033 |
| BRAF mutations | 1.055(0.591−1.882) | 0.857 | 1.040(0.484−2.237) | 0.920 |
| RAS mutations | 1.940(0.938−4.013) | 0.074 | 3.356(1.277−8.818) | 0.014 |
| TMB | 2.963(1.636−5.367) | <0.001 | 1.092(0.457−2.609) | 0.843 |
| AHNAK2 | 1.061(1.025−1.097) | <0.001 | 1.074(1.031−1.120) | <0.001 |
Clinical value of AHNAK2
We analyzed the relationships between AHNAK2 and clinical parameters, including age, gender, stage, metastasis, N classification, T classification, pathologic type, and mutations in BRAF and RAS (Table 2, Supplementary Figure 1). AHNAK2 expression was significantly high in patients with an advanced stage, an advanced T classification, lymph node metastasis, increased BRAF mutations, decreased RAS mutations, and lower follicular PTC and higher tall-cell PTC proportions.
Table 2. Comparison of clinical parameters between the L-AHNAK2 and H-AHNAK2 groups in PTC.
| Clinical parameters | L-AHNAK2 (n=376, %) | H-AHNAK2 (n=125, %) | P-value |
| Age(y) | |||
| <55 | 257(68.4) | 77(61.6) | 0.165 |
| ≥55 | 119(31.6) | 48(38.4) | |
| Gender | |||
| Female | 272(72.3) | 94(75.2) | 0.532 |
| Male | 135(27.7) | 31(24.8) | |
| Stage | |||
| I | 224(59.9) | 57(45.6) | <0.001 |
| II | 46(12.3) | 6(4.8) | |
| III | 70(18.7) | 41(32.8) | |
| IV | 34(9.1) | 21(16.8) | |
| NA | 2 | 0 | |
| Metastasis | |||
| M0 | 209(97.7) | 73(94.8) | 0.214 |
| M1 | 5(2.3) | 4(5.2) | |
| NA | 162 | 48 | |
| N classification | |||
| N0 | 186(55.5) | 43(37.1) | 0.001 |
| N1 | 149(44.5) | 73(62.9) | |
| NA | 41 | 9 | |
| T classification | |||
| T1 | 120(32.1) | 22(17.6) | <0.001 |
| T2 | 134(35.8) | 30(24.0) | |
| T3 | 111(29.7) | 59(47.2) | |
| T4 | 9(2.4) | 14(11.2) | |
| NA | 2 | 0 | |
| Pathologic type | |||
| Classical | 254(67.6) | 101(80.8) | <0.001 |
| Follicular | 100(26.6) | 1(0.8) | |
| Tall Cell | 13(3.5) | 23(18.4) | |
| Other | 9(2.4) | 0(0.0) | |
| BRAF | |||
| Wild-type | 181(50.4) | 14(11.5) | <0.001 |
| Mutated | 178(49.6) | 108(88.5) | |
| NA | 17 | 3 | |
| RAS | |||
| Wild-type | 299(83.3) | 122(100) | <0.001 |
| Mutated | 60(16.7) | 0(0.0) | |
| NA | 17 | 3 |
Interestingly, in the study of the relationship between AHNAK2 expression and gene mutations in PTC (Supplementary Figure 1A), we found that AHNAK2 expression was positively correlated with BRAF mutations (Supplementary Figure 1B) and negatively correlated with RAS (NRAS, HRAS and KRAS) mutations (Supplementary Figure 1C–1E).
Screening modules and genes related to AHNAK2
To construct a weighted coexpression network and screen for modules and genes related to AHNAK2, 2696 differentially expressed genes (DEGs) between PTC and normal tissues from The Cancer Genome Atlas (TCGA) were selected and subjected to weighted gene coexpression network analysis (WGCNA) (475 patients with complete clinical information were selected) (Figure 2A and 2B). After a series of adjustments for WGCNA parameters, the DEGs were divided into 11 modules by average linkage hierarchical clustering (Figure 2C–2F). The blue module, which contains 407 genes, exhibited the highest correlation with AHNAK2 expression (Pearson’s correlation coefficient =0.65, P<0.0001) (Figure 2G). Fifty-seven genes in the blue module were selected as hub genes (absolute module membership [MM] > 0.5 and absolute gene significance [GS] > 0.5) (Figure 2H).
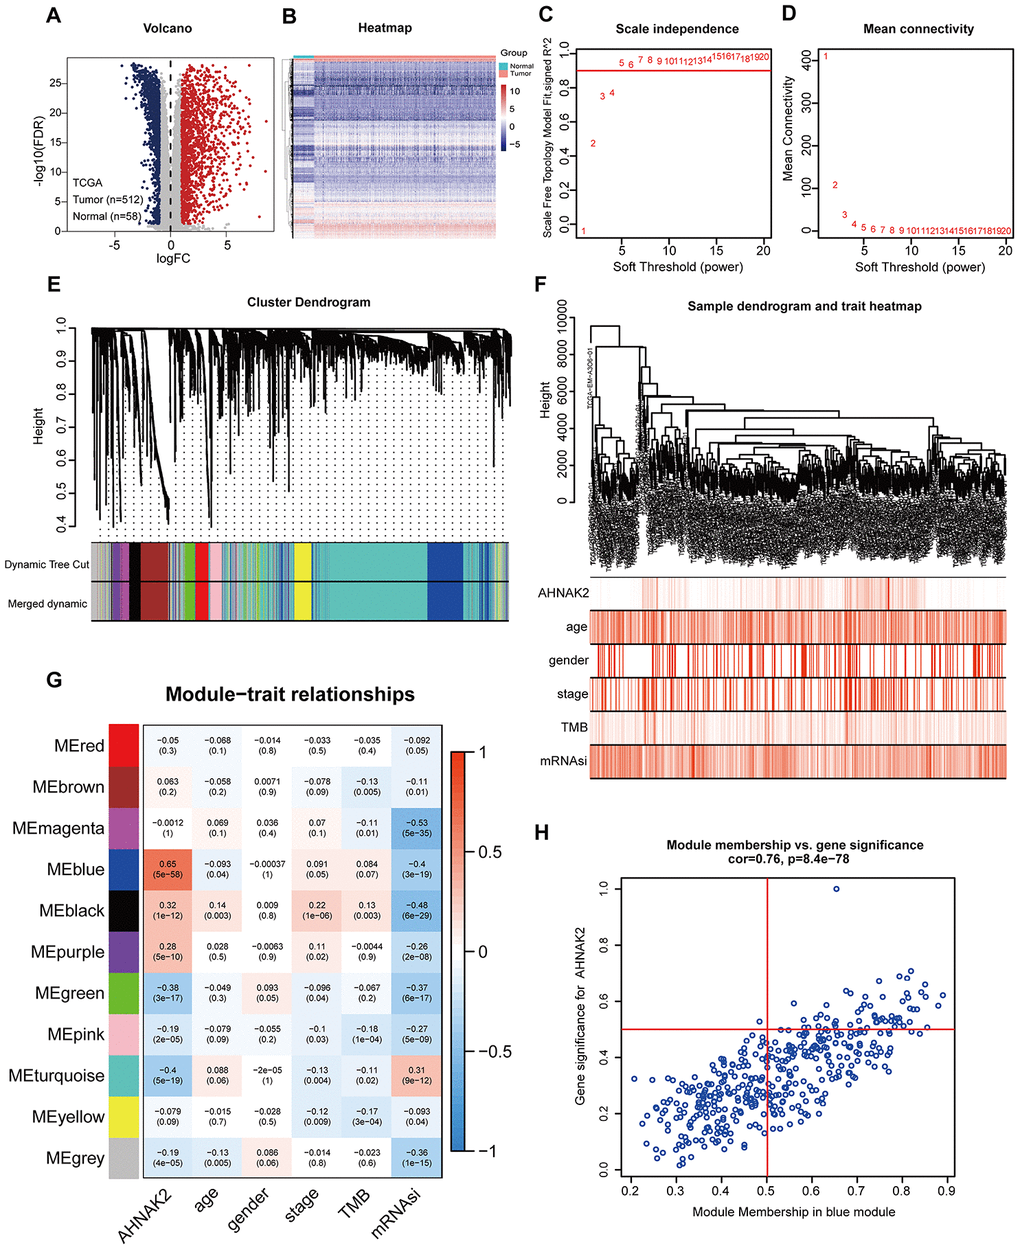
Figure 2. Screening for modules and genes related to AHNAK2 in PTC. (A) Volcano plot of DEGs between PTC and adjacent tissues in TCGA data. (B) Heatmap of DEGs between PTC and adjacent tissues in TCGA data. (C) Calculation of the scale-free fit index of various soft-thresholding powers (β). (D) Analysis of the mean connectivity of various soft-thresholding powers (β). (E) Clustering dendrogram of 475 PTC patients. (F) A total of 2696 DEGs were clustered based on the dissimilarity measure (1-TOM) and were divided into 11 modules. (G) A correlation heatmap between module eigengenes and clinical parameters (AHNAK2 was used as the main research object) of PTC. (H) Scatter plot of blue module eigengenes.
Analysis of the potential mechanism of AHNAK2
Cell adhesion- and cell junction-related pathways were the most frequently noted pathways in the functional enrichment analysis of the 407 blue module genes. “Cell-cell adhesion via plasma membrane adhesion molecules”, “cell-cell junction”, and “cell adhesion mediator activity” were the most significant Gene Ontology (GO) terms for cellular components, biological processes and molecular functions, respectively (Figure 3A). “Cytokine−cytokine receptor interaction” was the most significant pathway in the Kyoto Encyclopedia of Genes and Genomes (KEGG) analysis (Figure 3B). In addition, we constructed a protein–protein interaction (PPI) network with the 57 hub genes and found that ICAM1 and FN1 play key roles (Figure 3C).
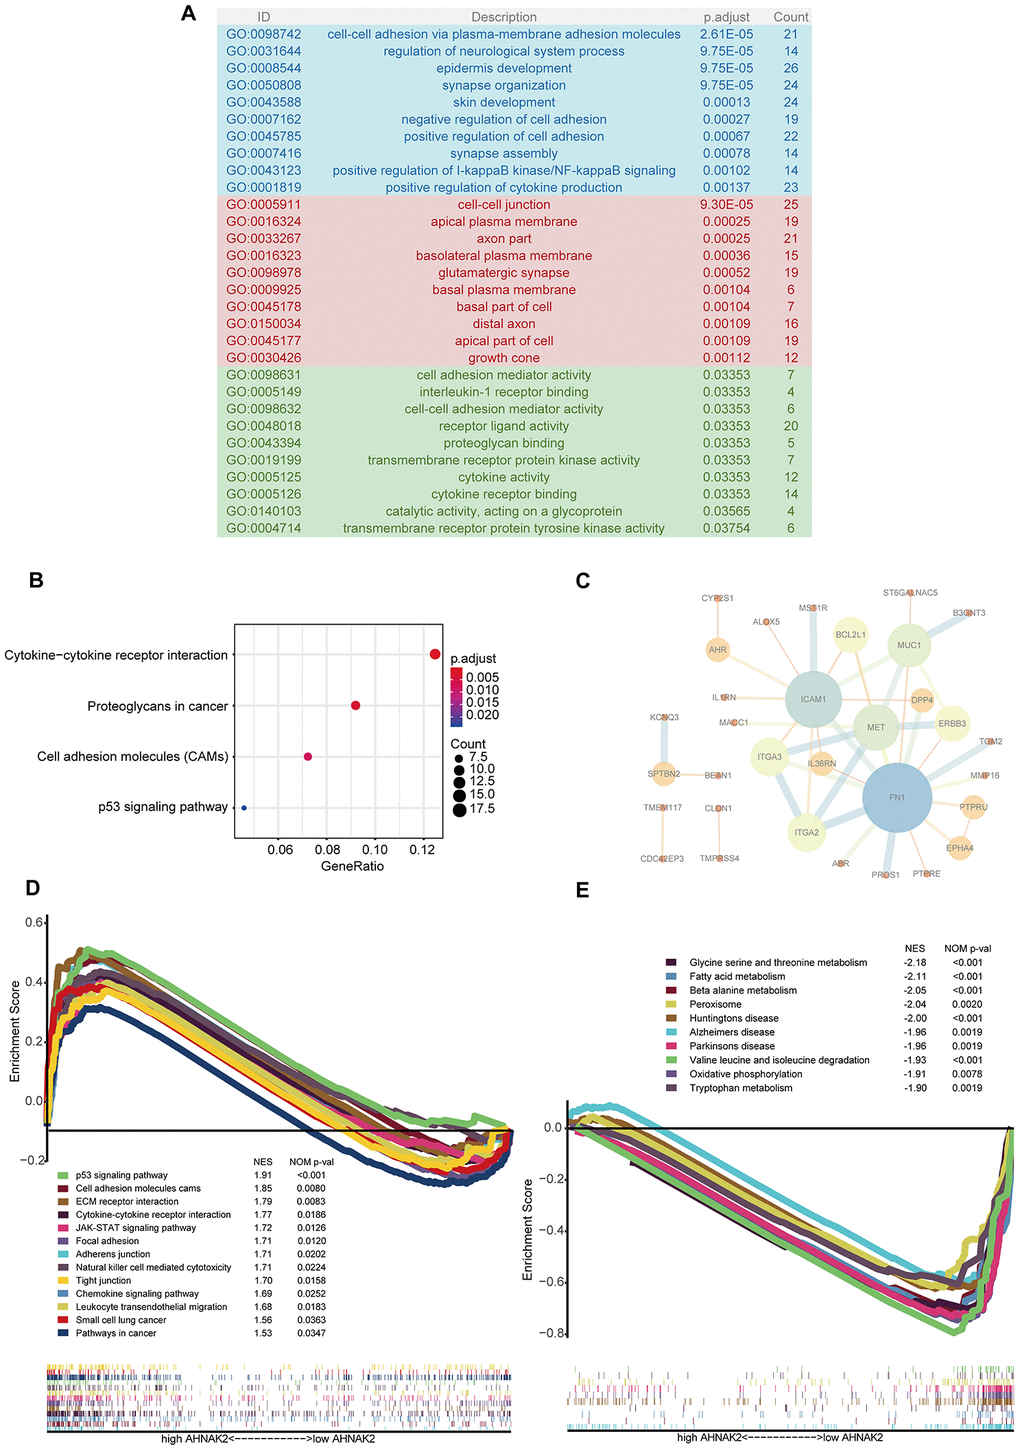
Figure 3. Potential mechanisms of AHNAK2 in PTC. (A) GO analysis of 407 blue module eigengenes; the blue, red and green areas represent cellular components, biological processes and molecular functions, respectively. (B) KEGG analysis of blue module eigengenes: the four most significantly enriched pathways. (C) PPIs of hub genes. (D) Enriched pathways in the H-AHNAK2 group based on GSEA. (E) Enriched pathways in the L-AHNAK2 group based on GSEA.
Additionally, gene set enrichment analysis (GSEA) was used to identify the mechanism and functional differences between the L-AHNAK2 group and H-AHNAK2 group. The H-AHNAK2 group was enriched in the following terms: 1. Cell adhesion- and cell junction-related pathways: cell adhesion molecules, focal adhesion, adherens junction, and tight junction; 2. Immune-related pathways: cytokine-cytokine receptor interaction, JAK-STAT signaling pathway, natural killer cell-mediated cytotoxicity, chemokine signaling pathway, and leukocyte transendothelial migration; and 3. Cancer-related pathways: p53 signaling pathway, small cell lung cancer, and pathways in cancer (Figure 3D). Conversely, the L-AHNAK2 group was enriched in metabolism-related pathways: glycine serine and threonine metabolism, fatty acid metabolism, beta alanine metabolism, peroxisome, valine leucine and isoleucine degradation, oxidative phosphorylation, and tryptophan metabolism (Figure 3E).
Further analysis of the relationship between AHNAK2 and immune infiltration
The results of the ESTIMATE analysis suggested that the H-AHNAK2 group had a higher immune score and stromal score than the L-AHNAK2 group, while the tumor purity score was lower (Figure 4A–4D). These results indicate that the proportions of immune cells and stromal cells are higher, and that the proportion of tumor cells is lower in the H-AHNAK2 group than in the L-AHNAK2 group. The TIMER analysis showed that AHNAK2 has significant positive correlations with B cells, CD4+ T cells, macrophages, neutrophils and dendritic cells (DCs) in PTC (Figure 4E). The results of the TISIDB analysis suggested that AHNAK2 has positive correlations with 28 tumor-infiltrating lymphocyte (TIL) types (Figure 4F) and human leukocyte antigens (HLAs) (Figure 4G) across human cancers, which is particularly significant in THCA (papillary thyroid carcinoma in TCGA).
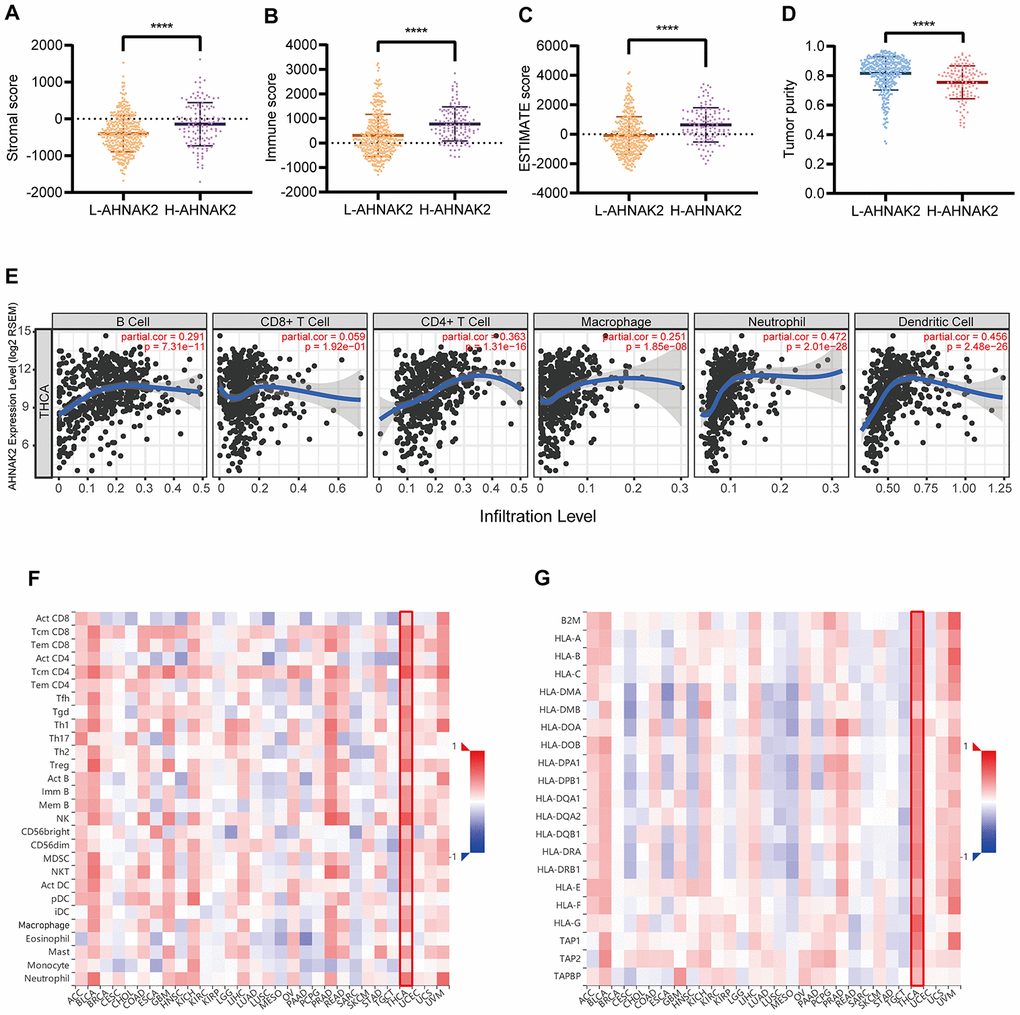
Figure 4. AHNAK2 is closely related to immunity in PTC. Comparison of (A) stromal scores, (B) immune scores, (C) ESTIMATE scores, and (D) tumor purity between the L-AHNAK2 and H-AHNAK2 groups based on ESTIMATE. (E) TIMER analysis of purity-corrected partial Spearman’s correlation between the expression of AHNAK2 and six immune cells in THCA. (F) Correlation analysis between the expression of AHNAK2 and 28 types of TILs across human cancers by TISIDB. (G) Correlation analysis between the expression of AHNAK2 and MHCs across human cancers by TISIDB. *P<0.05, ** P<0.01, *** P<0.001, **** P<0.0001 here and in the following figures.
Analysis of AHNAK2 methylation in PTC
Our data show that the methylation level of AHNAK2 in PTC tissues is significantly lower than that in normal tissues (Figure 5A). A significant negative correlation was identified between the methylation level of AHNAK2 and the expression level of AHNAK2 (Spearman r=-0.678, P<0.0001) (Figure 5B). Among the DNA methylation sites of AHNAK2, cg06799735, cg01513078, cg11138227 and cg23385208 had the most significant negative correlations with the AHNAK2 expression level (Table 3).
Table 3. Spearman correlations between AHNAK2 methylation sites and AHNAK2 expression.
| Methylation site | Correlation coefficient | P value |
| cg06799735 | -0.823 | 1.16E-124 |
| cg01513078 | -0.765 | 1.60E-97 |
| cg11138227 | -0.653 | 2.33E-62 |
| cg23385208 | -0.507 | 3.44E-34 |
| cg01412886 | -0.252 | 9.76E-09 |
| cg09796640 | -0.252 | 1.08E-08 |
| cg01987417 | -0.245 | 2.52E-08 |
| cg06903818 | -0.189 | 2.03E-05 |
| cg07828276 | -0.178 | 5.81E-05 |
| cg04908382 | 0.174 | 8.61E-05 |
| cg26082174 | -0.169 | 1.39E-04 |
| cg02048807 | -0.132 | 0.003 |
| cg21868779 | -0.118 | 0.008 |
| cg07450030 | -0.097 | 0.031 |
| cg14976660 | -0.096 | 0.032 |
| cg02719508 | -0.086 | 0.055 |
| cg18958585 | -0.078 | 0.080 |
| cg13108289 | 0.073 | 0.103 |
| cg01238264 | 0.048 | 0.280 |
| cg10207355 | -0.045 | 0.315 |
| cg05376485 | -0.044 | 0.324 |
| cg14046988 | 0.036 | 0.427 |
| cg04725566 | 0.035 | 0.427 |
| cg19901468 | 0.03 | 0.504 |
| cg07071690 | -0.026 | 0.564 |
| cg03006175 | -0.017 | 0.699 |
| cg16396153 | -0.007 | 0.875 |
| cg17340268 | -0.005 | 0.910 |
| cg27161497 | -0.005 | 0.915 |
| cg16097532 | -0.002 | 0.969 |
| cg13599499 | NA | NA |
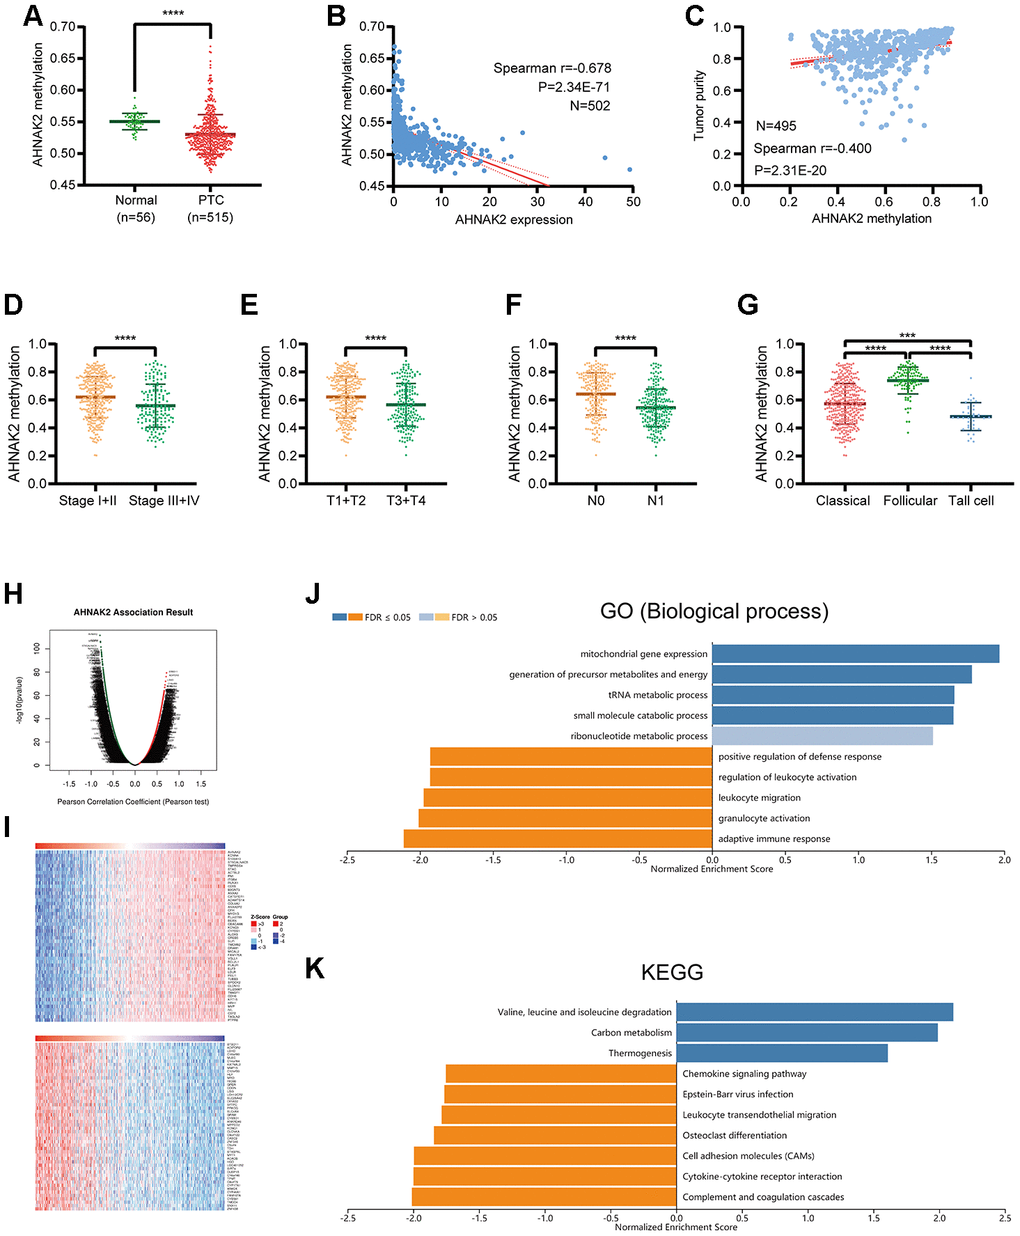
Figure 5. Analysis of AHNAK2 methylation in PTC. (A) AHNAK2 methylation levels were compared between PTC and normal tissues. (B) Correlation analysis between AHNAK2 methylation and AHNAK2 expression in PTC. (C) Correlation analysis between AHNAK2 methylation and tumor purity in PTC based on LinkedOmics.AHNAK2 methylation levels among PTC patients with different (D) stages, (E) T classifications, (F) N classifications, and (G) histological types. (H) AHNAK2 methylation was highly correlated with genes identified by the Pearson test in the THCA cohort based on LinkedOmics. (I) Heatmaps of the top 50 genes positively and negatively correlated with AHNAK2 in TCHA based on LinkedOmics. (J) Significantly enriched GO biological process analysis and (K) KEGG pathways of AHNAK2 methylation in the THCA cohort.
Moreover, we found significant connections between AHNAK2 methylation and clinical parameters such as tumor purity, stage, T classification, N classification and histological type (Figure 5C–5G).
To understand the biological significance of AHNAK2 methylation in THCA, a functional module of LinkedOmics was used to examine AHNAK2 coexpression pattern in the THCA cohort. Based on RNAseq, we screened 9,944 genes related to AHNAK2 methylation (false discovery rate (FDR) <0.01) (Figure 5H). The top 50 significant genes that were positively and negatively correlated with AHNAK2 methylation are presented as two heatmaps in Figure 5I. The GO (biological process) analysis results derived by GSEA were significant; the results indicated that AHNAK2 methylation coexpressed genes participate primarily in metabolism-related pathways, while genes related to activities such as the adaptive immune response, granulocyte activation, leukocyte migration, regulation of leukocyte activation, and positive regulation of the defense response were inhibited. KEGG pathway analysis also showed that genes related to the complement and coagulation cascades, cytokine-cytokine receptor interaction, cell adhesion molecules, and Epstein–Barr virus infection, among other pathways, were inhibited. These results illustrate the extensive effects of AHNAK2 methylation on transcriptome and immune-related pathways.
Gene expression omnibus (GEO) verification of the diagnostic value of AHNAK2
By analyzing mRNA expression in 8 GEO validation cohorts (GSE3467, GSE3678, GSE5364, GSE27155, GSE33630, GSE58545, GSE53157, and GSE60542), we verified the efficacy of AHNAK2 in distinguishing PTC from normal tissues (Figure 6A–6P).
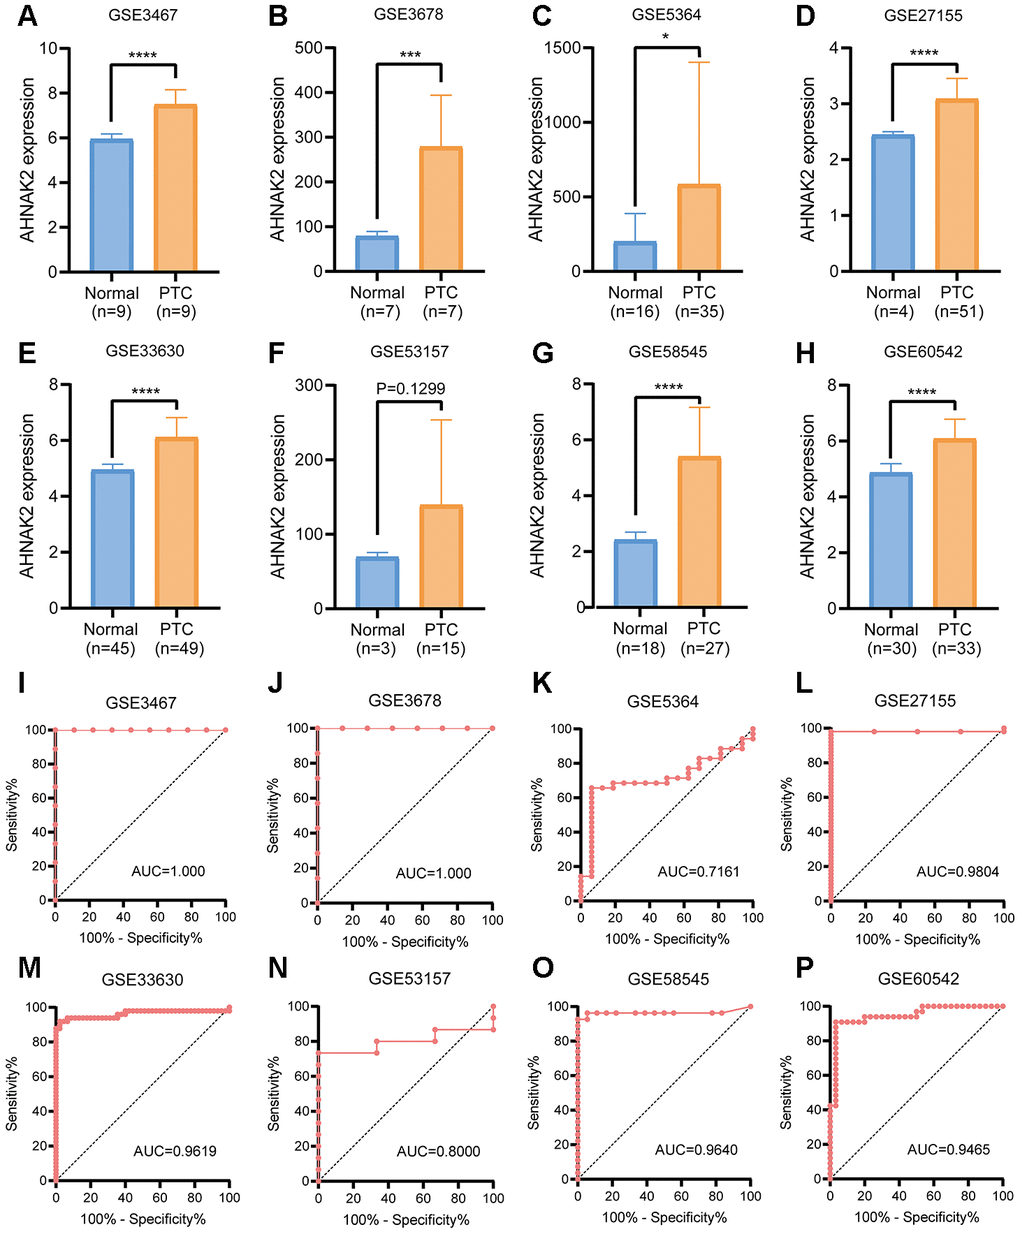
Figure 6. GEO verification of the diagnostic value of AHNAK2 in PTC. (A–H) mRNA expression levels of AHNAK2 in 8 GEO verification cohorts (GSE3467, GSE3678, GSE5364, GSE27155, GSE33630, GSE58545, GSE53157, and GSE60542). (I–P) ROC curves were generated to verify the diagnostic performance of AHNAK2 expression in the verification cohorts.
Generalization value of AHNAK2 in pan-cancer
To investigate whether AHNAK2 has broad value, we performed a series of studies on AHNAK2 across all cancers. Gene Expression Profiling Interactive Analysis (GEPIA) showed that AHNAK2 expression status varies in different cancers (Figure 7A). TISIDB showed that the high expression of AHNAK2 in pan-cancer tended to be accompanied by an advanced tumor stage (Figure 7B) and short overall survival (OS) (Figure 7C). K-M survival analysis showed that the high AHNAK2 group had significant associations with short OS in bladder urothelial carcinoma (BLCA), glioblastoma multiforme (GBM), lung adenocarcinoma (LUAD), mesothelioma (MESO), pancreatic adenocarcinoma (PAAD), skin cutaneous melanoma (SKCM) and uveal melanoma (UVM) (Figure 7D–7J). AHNAK2 is an extremely significant gene in the survival statistics of a large number of pan-cancer samples (N = 9497, HR = 1.4, P<0.0001) (Figure 7K).
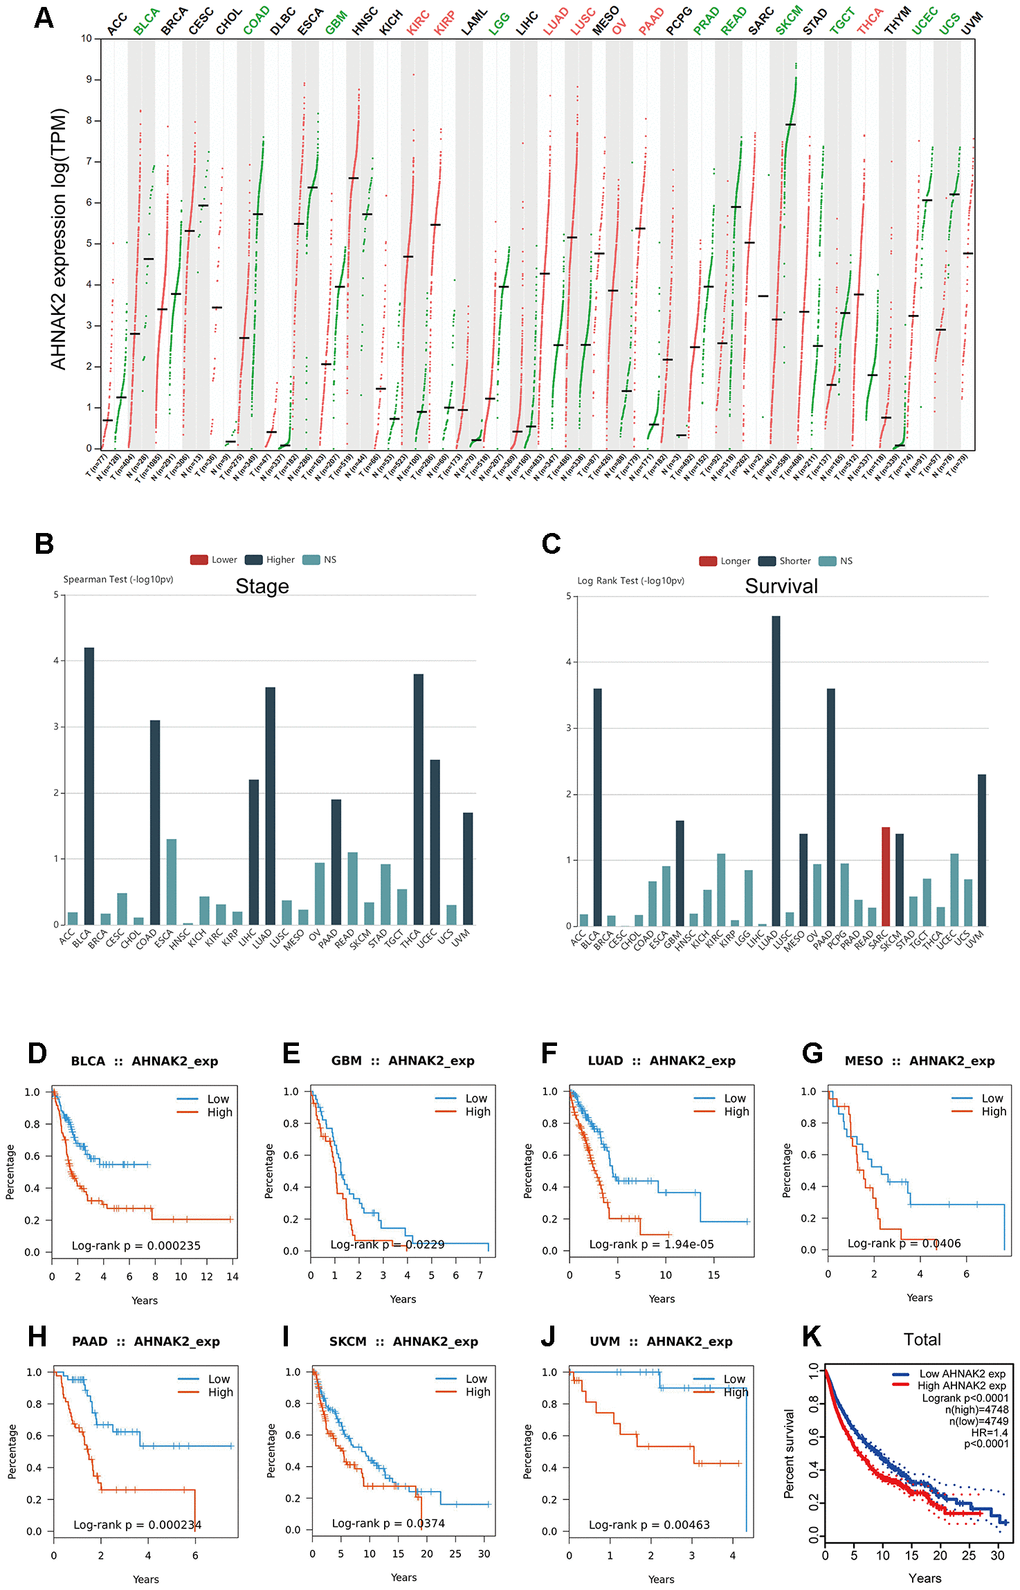
Figure 7. Generalization value of AHNAK2 in pan-cancer. (A) Comparison of AHNAK2 mRNA expression between pan-cancer cancerous and paracancerous tissues based on GEPIA. (B) Associations between AHNAK2 expression and stage across human cancers based on TISIDB. (C) Associations between AHNAK2 expression and overall survival across human cancers based on TISIDB. K-M survival analysis of (D) BLCA, (E) GBM, (F) LUAD, (G) MESO, (H) PAAD, (I) SKCM, (J) UVM, and (K) pan-cancer in the low AHNAK2 and high AHNAK2 groups based on TISIDB and GEPIA. NS: no significance.
Discussion
Our research suggests that AHNAK2 can be a biomarker for the diagnosis and prognosis of PTC. AHNAK2 functions mainly in cell adhesion-, cell junction-, and immune-related pathways. AHNAK2 also has extensive prognostic value in pan-cancer.
We previously found that AHNAK2 has a significant negative correlation with the prognosis of PTC and used AHNAK2 as one of the model genes for incorporation into prognostic models. Using this preliminary finding, we conducted a systematic study on the role of AHNAK2 in PTC. In recent years, many studies have reported that AHNAK2 could be a biomarker for the diagnosis and prognosis of PDAC, ccRCC, thymic carcinogenesis, bladder cancer, gastric cancer, and UM [11–18]. Kim et al. [20] also noted that high CXCL16 expression combined with the high expression levels of related genes (e.g., AHNAK2 and THBS2) was associated with poor recurrence-free survival in PTC patients. However, a systematic investigation of AHNAK2 in PTC has not been conducted. Our research fills the knowledge gap in the study of AHNAK2 in PTC and reveals the potential mechanism of AHNAK2 in PTC. This study also provides strong support for AHNAK2 as a prognostic biomarker for pan-cancer.
AHNAK2 has been described as a diagnostic biomarker in PDAC [11, 12], thymic carcinoma [15], and bladder cancer [16]. We found that overexpression of AHNAK2 in PTC tissues can be used to distinguish between PTC and normal tissues. We further verified the outstanding clinical diagnostic efficacy of AHNAK2 in 8 GEO verification cohorts.
AHNAK2 has been described as a prognostic biomarker in ccRCC [14] and PDAC [11, 13]. Our results show that AHNAK2 can be used as an independent prognostic predictor in PTC and to classify the PTC population and provide personalized treatment to reduce harm to patients caused by overtreatment. AHNAK2 may play a role in promoting the proliferation and migration of UM cells by regulating the PI3K signaling pathway [18]. A recent study also found that AHNAK2 is a target gene of HIF1α, which mediates EMT and stem cell characteristics driven by the hypoxia pathway, thereby promoting the progression of ccRCC [14]. AHNAK2 expression is significantly high in patients with an advanced cancer stage, an advanced T classification, lymph node metastasis, and increased BRAF mutations, showing a positive correlation with PTC progression. These findings imply that AHNAK2 may exert a tumor-promoting effect in PTC.
Interestingly, the two genes with the highest mutation rates in PTC [21] exhibited a notable trend: BRAF mutations were positively associated with AHNAK2 expression, while RAS mutations were negatively correlated with AHNAK2 expression.
Through functional enrichment analysis of the WGCNA-selected module eigengenes, AHNAK2 was determined to be most closely related to cell adhesion and cell junction pathways and inflammatory pathways in PTC. The GSEA results also revealed that AHNAK2 may promote progression in PTC through cell adhesion-, cell junction-, immune-, and cancer-related pathways.
Previous studies have noted that AHNAK2, as a scaffolding protein, is associated with voltage-gated calcium channels [9], and calcium plays a key role in the regulation of cell adhesion and cell junctions [22, 23]. Thus, these results can help explain the enrichment of cell adhesion- and cell junction-related pathways in our study.
Related reports of AHNAK2 in systemic lupus erythematosus (SLE) indicate its potential link with immunity [24, 25]. AHNAK2 is a critical element of the stress-induced FGF1 export pathway [19]. FGF1 is a nonclassically released growth factor that regulates carcinogenesis, angiogenesis and inflammation in tumors. Based on the results of our previous research and functional analysis, we further explored the relationship between AHNAK2 and immunity in PTC. Through ESTIMATE analysis, we found that high AHNAK2 expression indicates high degrees of immune and stromal cell infiltration and low tumor purity in the PTC microenvironment. The TIMER analysis showed that AHNAK2 is positively correlated with immune infiltration. The correlation analysis between AHNAK2 and 28 immune cell types in TISIDB showed that the entire immune system and AHNAK2 are positively correlated in PTC. The above results suggest that AHNAK2 may promote the occurrence and development of PTC through immune-related pathways.
AHNAK2 is uniquely monomethylated by the protein lysine monomethyltransferase (SMYD2) and is involved in human esophageal squamous carcinoma (ESCC) [26]. Ohmura et al. [27] reported that the methylation of AHNAK2 is associated with chemotherapy resistance in Epstein–Barr virus (EBV)-associated gastric cancer. Our research on PTC epigenetics has also shown that methylation may act as an upstream regulatory mechanism of AHNAK2 expression to inhibit its biological function.
Our study found that although the expression levels of AHNAK2 differ in various tumors, they are significantly positively correlated with tumor progression and short OS in pan-cancer patients, indicating that AHNAK2 also has universal prognostic value in pan-cancer.
Our study found that AHNAK2 can be used as a diagnostic and prognostic biomarker in PTC. AHNAK2 is believed to be able to identify critical cases of PTC and avoid overdiagnosis. The prognostic value of AHNAK2 should assist doctors in providing personalized treatment to patients and avoiding harm to patients caused by overtreatment. Studies in pan-carcinomas have shown the broad clinical application value of AHNAK2. Multiomics single-gene studies on the candidate oncogene AHNAK2 have enriched our understanding of the molecular function of AHNAK2 and have provided a new piece of the puzzle to the mechanism of cancer development and a basis for subsequent research on AHNAK2.
However, this study has some limitations. First, because TCGA is the only public database with sufficient data on both PTC gene expression and prognosis, we did not use other independent cohorts to verify the prognostic value of AHNAK2 in PTC. Second, the molecular functions of AHNAK2 in PTC were analyzed through bioinformatics, and the conclusions have not been further confirmed experimentally. However, related experimental research is ongoing.
AHNAK2 can be used as a diagnostic and prognostic biomarker in PTC. AHNAK2 may promote the progression of PTC through cell adhesion-, cell junction-, and immune-related pathways, and methylation may serve as an upstream regulator to inhibit the expression and biological functions of AHNAK2. AHNAK2 also has extensive prognostic value in pan-cancer. Research on the cancer candidate gene AHNAK2 will help us understand the development and prognosis of cancer and provide a piece of the puzzle to overcome cancer.
Materials and Methods
Materials
The TCGA THCA dataset, which contains 58 normal thyroid samples (N) and 512 PTC samples (T), was selected as the discovery cohort. The normalized level-three RNA-seq data (FPKM), simple nucleotide variation data (VarScan) and DNA methylation data were downloaded from the TCGA GDC (https://portal.gdc.cancer.gov/). The clinical information on TCGA THCA was downloaded from the University of California at Santa Cruz (UCSC) Xena browser (https://xena.ucsc.edu/).
Eight gene expression microarray datasets, each containing both PTC and normal thyroid tissue samples, were downloaded from the National Center for Biotechnology Information GEO database (http://www.ncbi.nlm.nih.gov/geo): GSE3467 (N=9, T=9), GSE3678 (N=7, T=7), GSE5364 (N=16, T=35), GSE27155 (N=4, T=51), GSE33630 (N=45, T=49), GSE58545 (N=18, T=27), GSE53157 (N=3, T=15), and GSE60542 (N=30, T=33).
Comparison of AHNAK2 expression between THCA and normal thyroid tissues
The mRNA expression levels of AHNAK2 in PTC and normal thyroid tissues were analyzed using TCGA data. We defined the top quarter as the H-AHNAK2 group (based on mRNA expression rank in the THCA dataset) and the remainder as the L-AHNAK2 group.
ROC curve analysis was used to evaluate the diagnostic efficacy of AHNAK2. The AUC followed the criteria 0.50–0.60 = fail, 0.60–0.70 = poor, 0.70–0.80 = fair, 0.80–0.90 = good and 0.90–1 = excellent.
Additionally, a direct comparison of AHNAK2 protein expression between PTC and normal thyroid tissues was performed by analyzing immunohistochemistry images from The Human Protein Atlas (https://www.proteinatlas.org) [28].
Analysis of the potential mechanism of AHNAK2 in PTC
GO and KEGG enrichment analyses
The genes in the key module were subjected to GO and KEGG enrichment analyses with DAVID 6.7 (https://david-d.ncifcrf.gov/).
PPI network analysis
The hub genes were input into the STRING database (version 11.0, https://string-db.org/) to analyze the interaction network of the hub gene-encoded proteins. The minimum required interaction score was set to 0.4 (medium confidence), and the results were visualized using Cytoscape (v3.7.2).
GSEA
GSEA software (Version 2.0.1) (http://www.broad.mit.edu/gsea) was used to explore the potential biological function of AHNAK2 in PTC. A normalized enrichment score (NES) ≥ 1.0, a p-value ≤ 0.05, and an FDR q-val ≤ 0.25 were used as criteria to sort the GSEA results (c2.cp.kegg.v6.2.symbols.gmt was used as the reference gene set) into the L-AHNAK2 and H-AHNAK2 groups after 1000 permutations for each analysis.
Further analysis of the relationship between AHNAK2 and immune infiltration in PTC
ESTIMATE
ESTIMATE [30], a method that uses gene expression signatures to infer the fractions of stromal and immune cells in tumor samples, was used to evaluate the levels of immune cell infiltration (immune score), the stromal content (stromal score), the stromal-immune comprehensive score (ESTIMATE score) and tumor purity for each THCA sample.
TIMER
The TIMER online database [31], a web server for comprehensive analysis of tumor-infiltrating immune cells, was used to analyze and visualize associations between AHNAK2 expression and the abundance of 6 tumor-infiltrating immune cell subtypes (B cells, CD4+ T cells, CD8+ T cells, macrophages, neutrophils, and DCs).
TISIDB
We used TISIDB, a comprehensive repository portal for tumor-immune system interactions, to determine the Spearman correlations between AHNAK2 expression and 28 TIL types across human cancers [32].
Analysis of AHNAK2 methylation in PTC
Based on DNA methylation data downloaded from TCGA, we compared the methylation levels of AHNAK2 between PTC and normal tissues. We analyzed the correlation between AHNAK2 methylation and AHNAK2 expression in PTC. We also performed a correlation analysis between each methylation site of AHNAK2 and AHNAK2 expression.
LinkedOmics is an online platform for analyzing multiomics data across 32 cancer types (http://www.linkedomics.org/) [33]. We downloaded and visualized the correlation results between AHNAK2 methylation and clinical parameters from LinkedOmics. Pearson correlations were used to analyze the AHNAK2 methylation-induced coexpression of genes, and the results are displayed with a volcano map and a heatmap. The functional modules of LinkedOmics are based on AHNAK2 methylation data, and GSEA was performed with data from GO (biological process) and KEGG pathway databases. We set the minimum number of genes (Size) =10 and simulations=1000 and selected a weighted set cover to reduce redundancy.
GEO verification of the diagnostic value of AHNAK2
mRNA expression and ROC curves were used to verify the diagnostic efficacy of AHNAK2 in 8 GEO datasets (GSE3467, GSE3678, GSE5364, GSE27155, GSE33630, GSE58545, GSE53157, and GSE60542).
Generalization of conclusions in pan-cancer
GEPIA (http://gepia.cancer-pku.cn/) is used as a tool to generalize conclusions in pan-cancer [34]. A comparison of AHNAK2 gene transcripts between PTC and normal thyroid tissues in pan-cancer was performed using TCGA and Genotype-Tissue Expression (GTEx) data (p-value <0.05 and |log2FC| >1). K-M curves in pan-cancer were generated using the cohort of TCGA data. We used TISIDB to analyze relationships between AHNAK2 expression and tumor stage in pan-cancer, as well as associations between AHNAK2 expression and OS.
Statistical analysis
K-M survival analysis was performed with the "survival" package (PFS was used as the endpoint). The chi-square test was used to test differences in clinical parameters between the L-AHNAK2 and H-AHNAK2 groups. The Spearman method was used to test for correlations. The Mann-Whitney test was used to compare two groups. The log-rank method was used to calculate significant P values for survival. R (v3.6.0) and SPSS version 25.0 software programs were used for statistical processing. Data were visualized with GraphPad Prism V.8.0 software and R.
Supplementary Materials
Author Contributions
ZX designed the analytical strategies, performed data analyses and wrote the manuscript. YL, XL, YZH, SW, SYW, JS and YCH performed data analyses, JZ conceived the research and wrote the manuscript.
Acknowledgments
We would like to thank the contributions of public databases such as the TCGA and GEO to human medicine.
Conflicts of Interest
The authors have no conflicts of interest.
Funding
This research was supported by the National Natural Science Foundation of China (81600602).
References
- 1. Siegel RL, Miller KD, Jemal A. Cancer statistics, 2020. CA Cancer J Clin. 2020; 70:7–30. https://doi.org/10.3322/caac.21590 [PubMed]
- 2. Cabanillas ME, McFadden DG, Durante C. Thyroid cancer. Lancet. 2016; 388:2783–95. https://doi.org/10.1016/S0140-6736(16)30172-6 [PubMed]
- 3. Li N, Du XL, Reitzel LR, Xu L, Sturgis EM. Impact of enhanced detection on the increase in thyroid cancer incidence in the United States: review of incidence trends by socioeconomic status within the surveillance, epidemiology, and end results registry, 1980-2008. Thyroid. 2013; 23:103–10. https://doi.org/10.1089/thy.2012.0392 [PubMed]
- 4. Schneider DF, Chen H. New developments in the diagnosis and treatment of thyroid cancer. CA Cancer J Clin. 2013; 63:374–94. https://doi.org/10.3322/caac.21195 [PubMed]
- 5. Fagin JA, Wells SA
Jr . Biologic and clinical perspectives on thyroid cancer. N Engl J Med. 2016; 375:1054–67. https://doi.org/10.1056/NEJMra1501993 [PubMed] - 6. Grogan RH, Kaplan SP, Cao H, Weiss RE, Degroot LJ, Simon CA, Embia OM, Angelos P, Kaplan EL, Schechter RB. A study of recurrence and death from papillary thyroid cancer with 27 years of median follow-up. Surgery. 2013; 154:1436–46. https://doi.org/10.1016/j.surg.2013.07.008 [PubMed]
- 7. Lin JS, Bowles EJ, Williams SB, Morrison CC. Screening for thyroid cancer: updated evidence report and systematic review for the US preventive services task force. JAMA. 2017; 317:1888–903. https://doi.org/10.1001/jama.2017.0562 [PubMed]
- 8. Kitahara CM, Sosa JA. The changing incidence of thyroid cancer. Nat Rev Endocrinol. 2016; 12:646–53. https://doi.org/10.1038/nrendo.2016.110 [PubMed]
- 9. Komuro A, Masuda Y, Kobayashi K, Babbitt R, Gunel M, Flavell RA, Marchesi VT. The AHNAKs are a class of giant propeller-like proteins that associate with calcium channel proteins of cardiomyocytes and other cells. Proc Natl Acad Sci USA. 2004; 101:4053–58. https://doi.org/10.1073/pnas.0308619101 [PubMed]
- 10. Han H, Kursula P. Periaxin and AHNAK nucleoprotein 2 form intertwined homodimers through domain swapping. J Biol Chem. 2014; 289:14121–31. https://doi.org/10.1074/jbc.M114.554816 [PubMed]
- 11. Klett H, Fuellgraf H, Levit-Zerdoun E, Hussung S, Kowar S, Küsters S, Bronsert P, Werner M, Wittel U, Fritsch R, Busch H, Boerries M. Identification and validation of a diagnostic and prognostic multi-gene biomarker panel for pancreatic ductal adenocarcinoma. Front Genet. 2018; 9:108. https://doi.org/10.3389/fgene.2018.00108 [PubMed]
- 12. Bhasin MK, Ndebele K, Bucur O, Yee EU, Otu HH, Plati J, Bullock A, Gu X, Castan E, Zhang P, Najarian R, Muraru MS, Miksad R, et al. Meta-analysis of transcriptome data identifies a novel 5-gene pancreatic adenocarcinoma classifier. Oncotarget. 2016; 7:23263–81. https://doi.org/10.18632/oncotarget.8139 [PubMed]
- 13. Lu D, Wang J, Shi X, Yue B, Hao J. AHNAK2 is a potential prognostic biomarker in patients with PDAC. Oncotarget. 2017; 8:31775–84. https://doi.org/10.18632/oncotarget.15990 [PubMed]
- 14. Wang M, Li X, Zhang J, Yang Q, Chen W, Jin W, Huang YR, Yang R, Gao WQ. AHNAK2 is a novel prognostic marker and oncogenic protein for clear cell renal cell carcinoma. Theranostics. 2017; 7:1100–13. https://doi.org/10.7150/thno.18198 [PubMed]
- 15. Saito M, Fujiwara Y, Asao T, Honda T, Shimada Y, Kanai Y, Tsuta K, Kono K, Watanabe S, Ohe Y, Kohno T. The genomic and epigenomic landscape in thymic carcinoma. Carcinogenesis. 2017; 38:1084–91. https://doi.org/10.1093/carcin/bgx094 [PubMed]
- 16. Witzke KE, Großerueschkamp F, Jütte H, Horn M, Roghmann F, von Landenberg N, Bracht T, Kallenbach-Thieltges A, Käfferlein H, Brüning T, Schork K, Eisenacher M, Marcus K, et al. Integrated fourier transform infrared imaging and proteomics for identification of a candidate histochemical biomarker in bladder cancer. Am J Pathol. 2019; 189:619–31. https://doi.org/10.1016/j.ajpath.2018.11.018 [PubMed]
- 17. Zhou YY, Kang YT, Chen C, Xu FF, Wang HN, Jin R. Combination of TNM staging and pathway based risk score models in patients with gastric cancer. J Cell Biochem. 2018; 119:3608–17. https://doi.org/10.1002/jcb.26563 [PubMed]
- 18. Li M, Liu Y, Meng Y, Zhu Y. AHNAK nucleoprotein 2 performs a promoting role in the proliferation and migration of uveal melanoma cells. Cancer Biother Radiopharm. 2019; 34:626–33. https://doi.org/10.1089/cbr.2019.2778 [PubMed]
- 19. Kirov A, Kacer D, Conley BA, Vary CP, Prudovsky I. AHNAK2 participates in the stress-induced nonclassical FGF1 secretion pathway. J Cell Biochem. 2015; 116:1522–31. https://doi.org/10.1002/jcb.25047 [PubMed]
- 20. Kim MJ, Sun HJ, Song YS, Yoo SK, Kim YA, Seo JS, Park YJ, Cho SW. CXCL16 positively correlated with M2-macrophage infiltration, enhanced angiogenesis, and poor prognosis in thyroid cancer. Sci Rep. 2019; 9:13288. https://doi.org/10.1038/s41598-019-49613-z [PubMed]
- 21. Rossi M, Buratto M, Tagliati F, Rossi R, Lupo S, Trasforini G, Lanza G, Franceschetti P, Bruni S, Degli Uberti E, Zatelli MC. Relevance of BRAF(V600E) mutation testing versus RAS point mutations and RET/PTC rearrangements evaluation in the diagnosis of thyroid cancer. Thyroid. 2015; 25:221–28. https://doi.org/10.1089/thy.2014.0338 [PubMed]
- 22. Stuart RO, Sun A, Panichas M, Hebert SC, Brenner BM, Nigam SK. Critical role for intracellular calcium in tight junction biogenesis. J Cell Physiol. 1994; 159:423–33. https://doi.org/10.1002/jcp.1041590306 [PubMed]
- 23. Kemler R, Ozawa M, Ringwald M. Calcium-dependent cell adhesion molecules. Curr Opin Cell Biol. 1989; 1:892–97. https://doi.org/10.1016/0955-0674(89)90055-0 [PubMed]
- 24. Akizuki S, Ishigaki K, Kochi Y, Law SM, Matsuo K, Ohmura K, Suzuki A, Nakayama M, Iizuka Y, Koseki H, Ohara O, Hirata J, Kamatani Y, et al. PLD4 is a genetic determinant to systemic lupus erythematosus and involved in murine autoimmune phenotypes. Ann Rheum Dis. 2019; 78:509–18. https://doi.org/10.1136/annrheumdis-2018-214116 [PubMed]
- 25. Wen L, Zhu C, Zhu Z, Yang C, Zheng X, Liu L, Zuo X, Sheng Y, Tang H, Liang B, Zhou Y, Li P, Zhu J, et al. Exome-wide association study identifies four novel loci for systemic lupus erythematosus in han Chinese population. Ann Rheum Dis. 2018; 77:417. https://doi.org/10.1136/annrheumdis-2017-211823 [PubMed]
- 26. Olsen JB, Cao XJ, Han B, Chen LH, Horvath A, Richardson TI, Campbell RM, Garcia BA, Nguyen H. Quantitative profiling of the activity of protein lysine methyltransferase SMYD2 using SILAC-based proteomics. Mol Cell Proteomics. 2016; 15:892–905. https://doi.org/10.1074/mcp.M115.053280 [PubMed]
- 27. Ohmura H, Ito M, Uchino K, Okada C, Tanishima S, Yamada Y, Momosaki S, Komoda M, Kuwayama M, Yamaguchi K, Okumura Y, Nakano M, Tsuchihashi K, et al. Methylation of drug resistance-related genes in chemotherapy-sensitive epstein-barr virus-associated gastric cancer. FEBS Open Bio. 2020; 10:147–57. https://doi.org/10.1002/2211-5463.12765 [PubMed]
- 28. Asplund A, Edqvist PH, Schwenk JM, Pontén F. Antibodies for profiling the human proteome-the human protein atlas as a resource for cancer research. Proteomics. 2012; 12:2067–77. https://doi.org/10.1002/pmic.201100504 [PubMed]
- 29. Langfelder P, Horvath S. WGCNA: an R package for weighted correlation network analysis. BMC Bioinformatics. 2008; 9:559. https://doi.org/10.1186/1471-2105-9-559 [PubMed]
- 30. Yoshihara K, Shahmoradgoli M, Martínez E, Vegesna R, Kim H, Torres-Garcia W, Treviño V, Shen H, Laird PW, Levine DA, Carter SL, Getz G, Stemke-Hale K, et al. Inferring tumour purity and stromal and immune cell admixture from expression data. Nat Commun. 2013; 4:2612. https://doi.org/10.1038/ncomms3612 [PubMed]
- 31. Li T, Fan J, Wang B, Traugh N, Chen Q, Liu JS, Li B, Liu XS. TIMER: a web server for comprehensive analysis of tumor-infiltrating immune cells. Cancer Res. 2017; 77:e108–10. https://doi.org/10.1158/0008-5472.CAN-17-0307 [PubMed]
- 32. Ru B, Wong CN, Tong Y, Zhong JY, Zhong SS, Wu WC, Chu KC, Wong CY, Lau CY, Chen I, Chan NW, Zhang J. TISIDB: an integrated repository portal for tumor-immune system interactions. Bioinformatics. 2019; 35:4200–02. https://doi.org/10.1093/bioinformatics/btz210 [PubMed]
- 33. Vasaikar SV, Straub P, Wang J, Zhang B. LinkedOmics: analyzing multi-omics data within and across 32 cancer types. Nucleic Acids Res. 2018; 46:D956–63. https://doi.org/10.1093/nar/gkx1090 [PubMed]
- 34. Tang Z, Li C, Kang B, Gao G, Li C, Zhang Z. GEPIA: a web server for cancer and normal gene expression profiling and interactive analyses. Nucleic Acids Res. 2017; 45:W98–102. https://doi.org/10.1093/nar/gkx247 [PubMed]