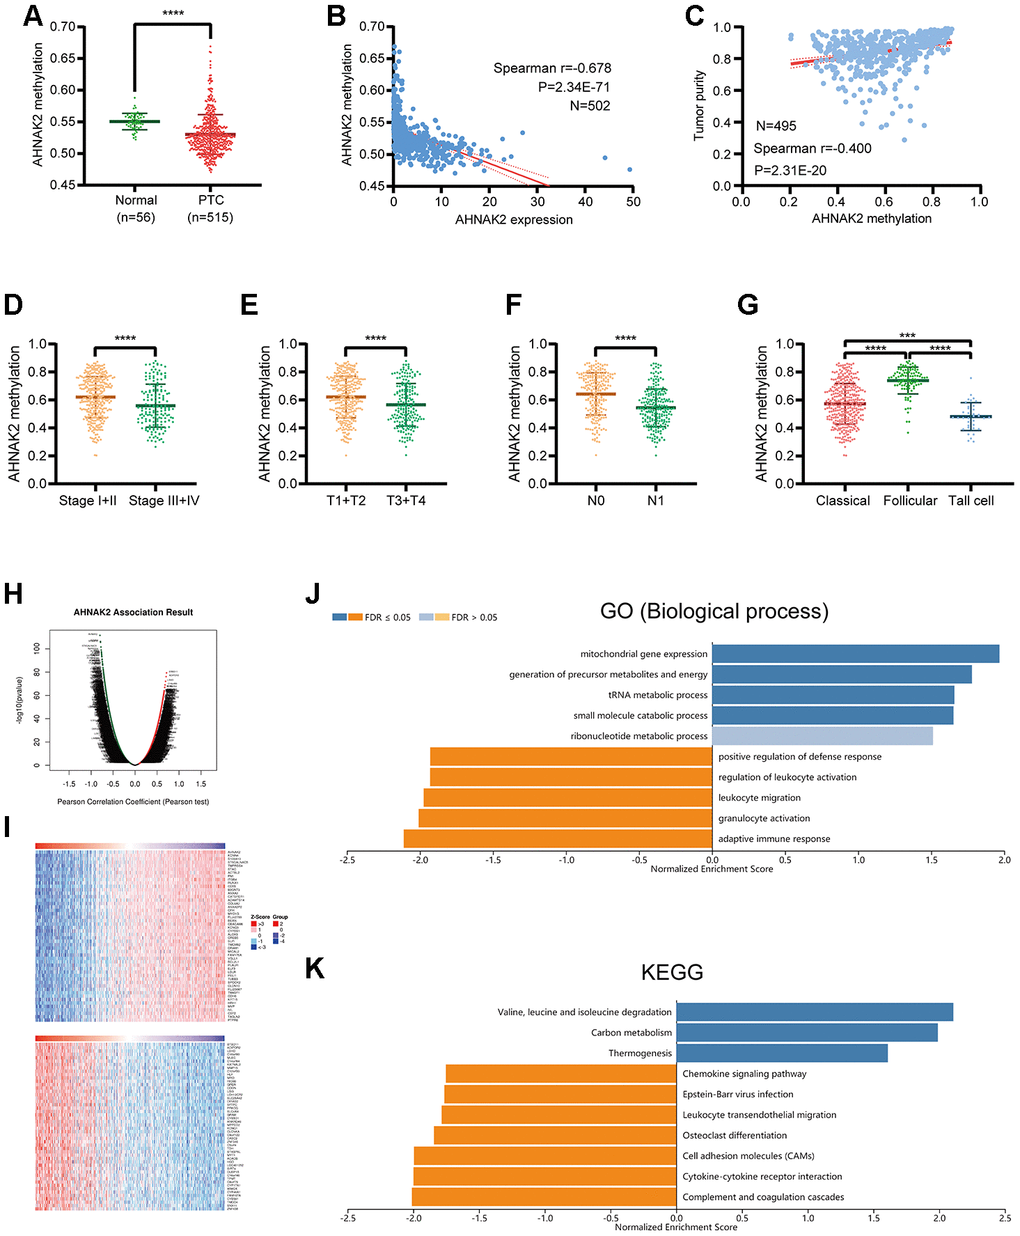
Figure 5.Analysis of AHNAK2 methylation in PTC. (A) AHNAK2 methylation levels were compared between PTC and normal tissues. (B) Correlation analysis between AHNAK2 methylation and AHNAK2 expression in PTC. (C) Correlation analysis between AHNAK2 methylation and tumor purity in PTC based on LinkedOmics.AHNAK2 methylation levels among PTC patients with different (D) stages, (E) T classifications, (F) N classifications, and (G) histological types. (H) AHNAK2 methylation was highly correlated with genes identified by the Pearson test in the THCA cohort based on LinkedOmics. (I) Heatmaps of the top 50 genes positively and negatively correlated with AHNAK2 in TCHA based on LinkedOmics. (J) Significantly enriched GO biological process analysis and (K) KEGG pathways of AHNAK2 methylation in the THCA cohort.