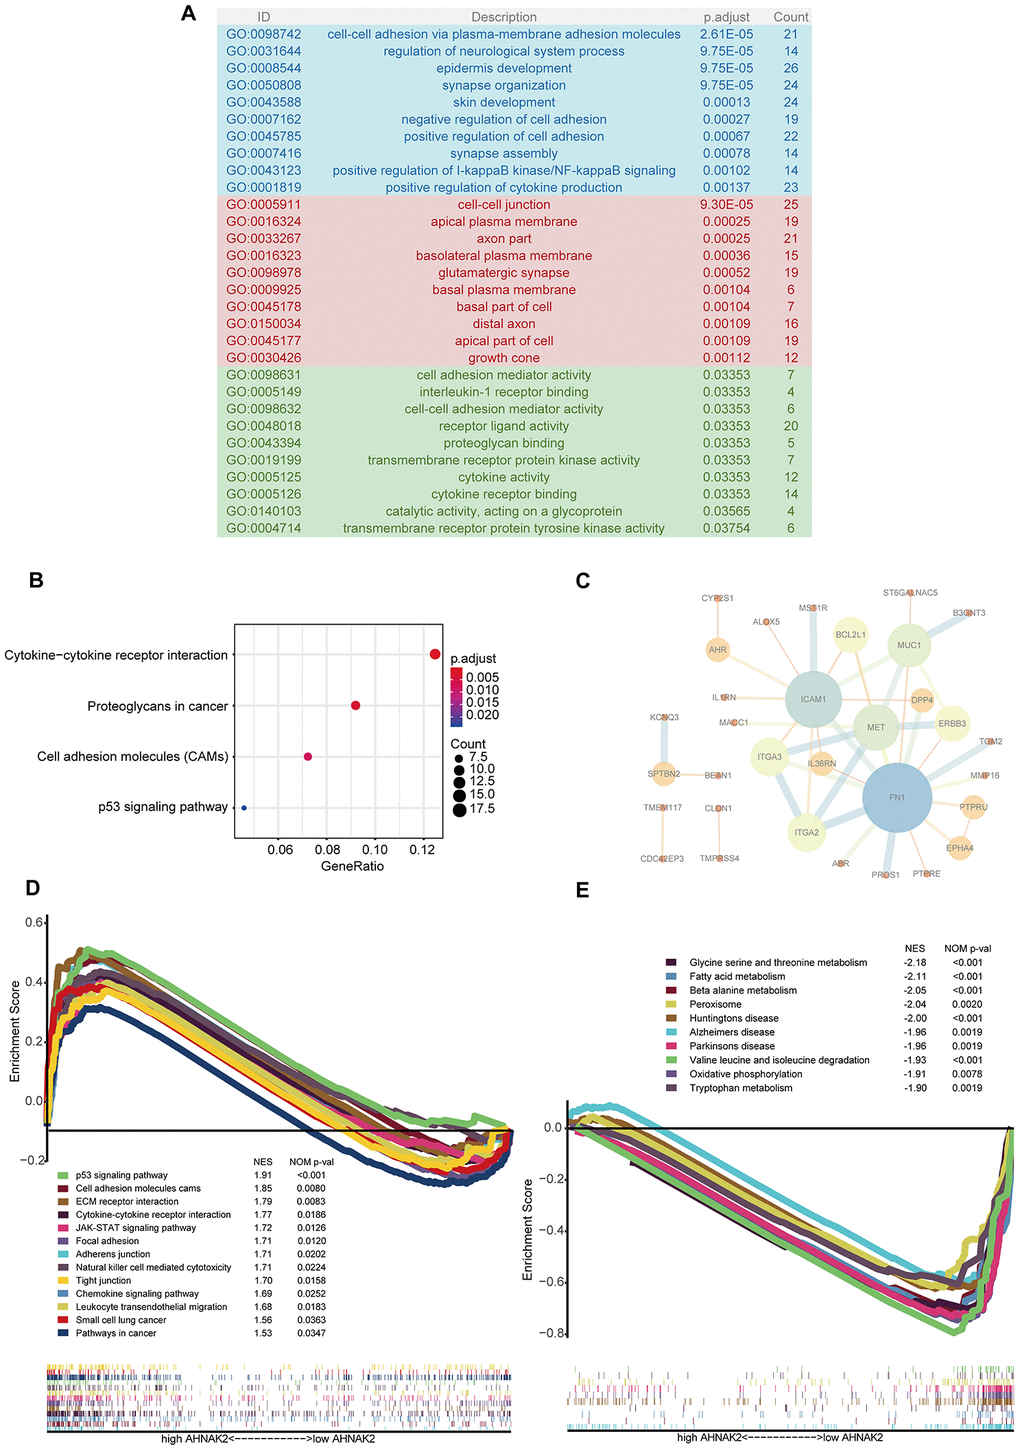
Figure 3.Potential mechanisms of AHNAK2 in PTC. (A) GO analysis of 407 blue module eigengenes; the blue, red and green areas represent cellular components, biological processes and molecular functions, respectively. (B) KEGG analysis of blue module eigengenes: the four most significantly enriched pathways. (C) PPIs of hub genes. (D) Enriched pathways in the H-AHNAK2 group based on GSEA. (E) Enriched pathways in the L-AHNAK2 group based on GSEA.