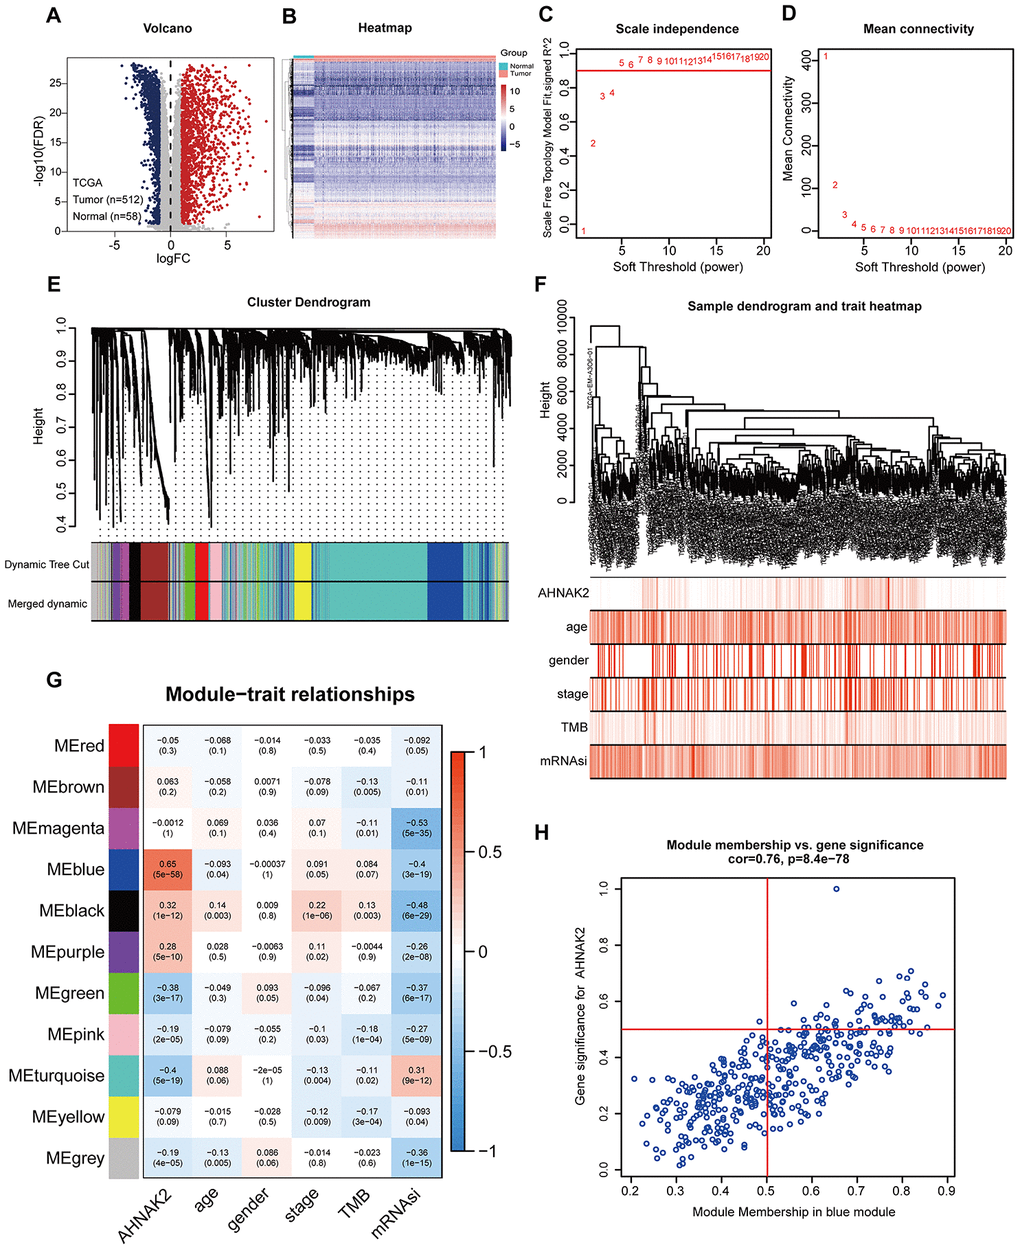
Figure 2.Screening for modules and genes related to AHNAK2 in PTC. (A) Volcano plot of DEGs between PTC and adjacent tissues in TCGA data. (B) Heatmap of DEGs between PTC and adjacent tissues in TCGA data. (C) Calculation of the scale-free fit index of various soft-thresholding powers (β). (D) Analysis of the mean connectivity of various soft-thresholding powers (β). (E) Clustering dendrogram of 475 PTC patients. (F) A total of 2696 DEGs were clustered based on the dissimilarity measure (1-TOM) and were divided into 11 modules. (G) A correlation heatmap between module eigengenes and clinical parameters (AHNAK2 was used as the main research object) of PTC. (H) Scatter plot of blue module eigengenes.