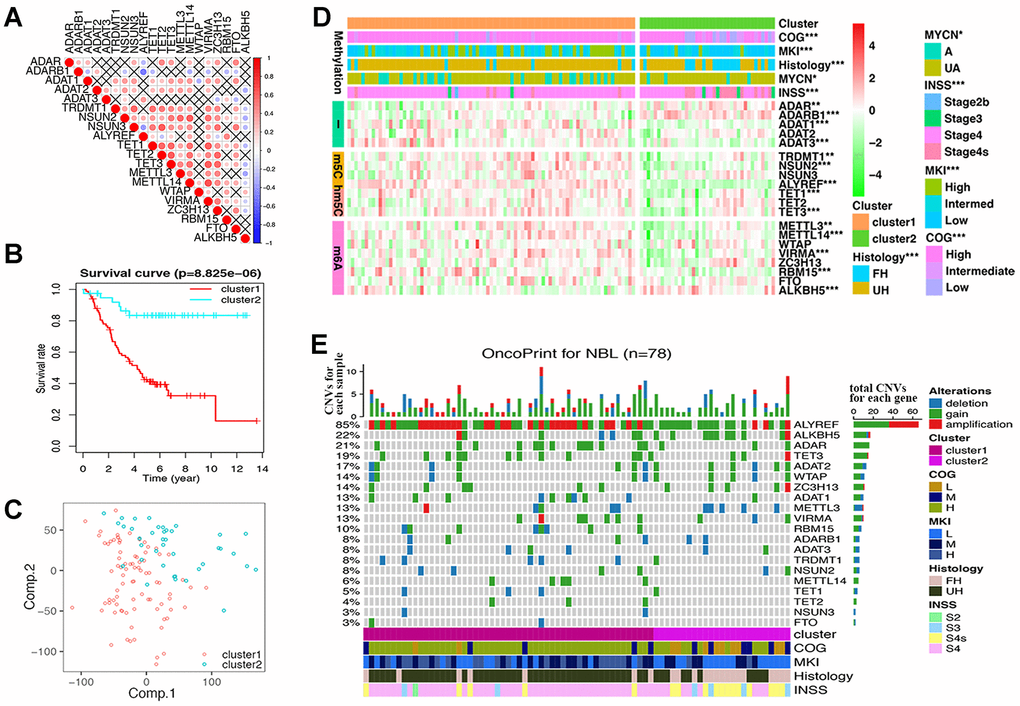
Figure 2.Differences of gene expression and CNV profile, survival and clinicopathological features in two groups defined by RNA modification regulators (RNA-MRs). (A) Spearman correlation analysis of RNA-MRs. Red: positive relation of gene expression between two genes; blue: negative relation. Color scale: the degree of relation. Cross (×): P>0.05 (no significant difference). (B) Kaplan–Meier overall survival curves for NBL patients in two groups. Ordinal: the percentage of survival; abscissa: survival years. "+" marks in line: censoring samples. (C) Principal component analysis of the transcriptome expression profile in the space of the first two principal components (Comp.). (D) Heatmap comparison of RNA-MRs for two groups. Horizontal color stripe above heatmap: one clinicopathological feature per line. Vertical color stripes: different methylation type regulated by each RNA-MR. Heatmap: expression differences of RNA-MRs (gradient color from green to red in each line showed downregulated to upregulated levels of each gene). *P < 0.05, **P < 0.01, and ***P < 0.001 between Cluster1 and Cluster2. (E) The OncoPrint of CNV pattern in two groups. Blue dot: deletion; green dot: gain; red dot: amplification. The upper barplot: the number of CNVs per patient; the right barplot: the number of genetic mutations per gene (corresponding rate was at left); the bottom color stripe: clinicopathological features for each patient.