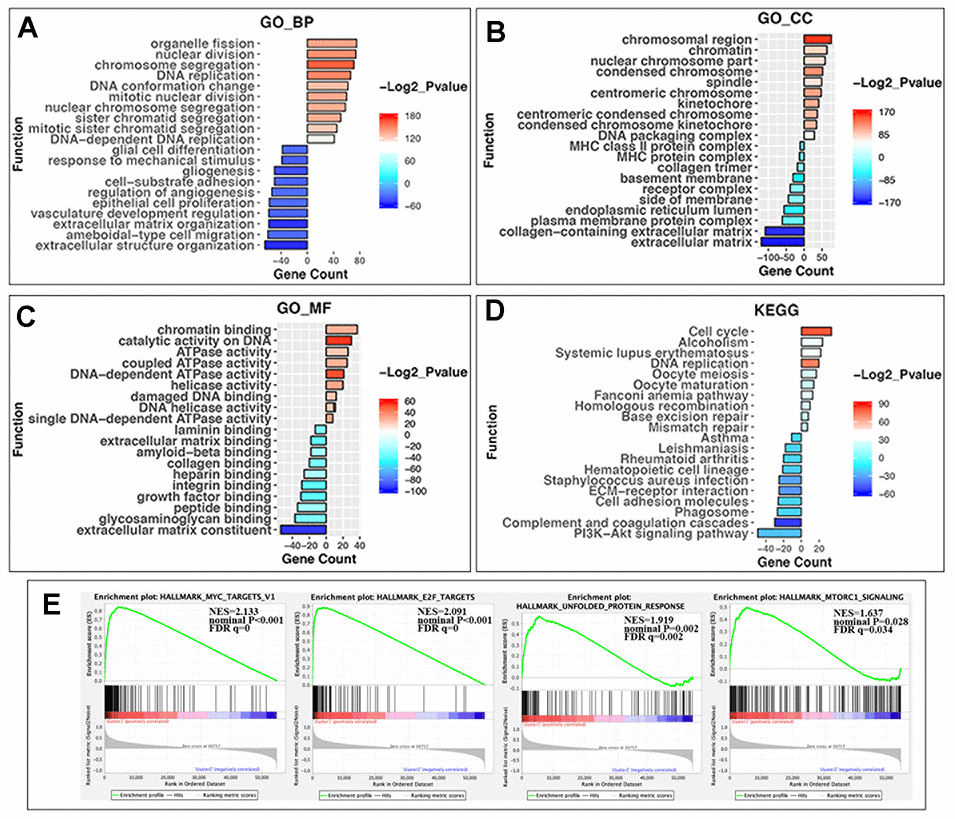
Figure 4.GO, KEGG pathway enrichment analysis and the gene set enrichment analysis (GSEA) of differentially expressed genes (DEGs) in two groups. (A) Biological process of GO analysis; (B) Cellular component of GO analysis; (C) Molecular function of GO analysis; (D) KEGG pathways analysis. Y-axis: name of enrichment item; X-axis: gene count in each item (positive value for cluster1 and negative for cluster2); gradient color of the bar chart: -Log2_Pvalue (values >0 for -Log2_Pvalue in Cluster1, and values <0 for -(-Log2_Pvalue) in Cluster2). (E) GSEA enrichment plots in HALLMARK datasets from left to right: MYC targets, E2F targets, unfolded protein response, and MTORC1 signaling. In each plot, top panels: enrichment score (ES) for each gene; bottom panels: the ranking metrics of each gene; Y-axis: ranking metric values; X-axis: ranks for all genes. NES: normalized ES. Norm P (nominal p value): the statistical significance of the observed ES for this plot. FDR q value: a significantly enriched enrichment plot if q< 0.25.