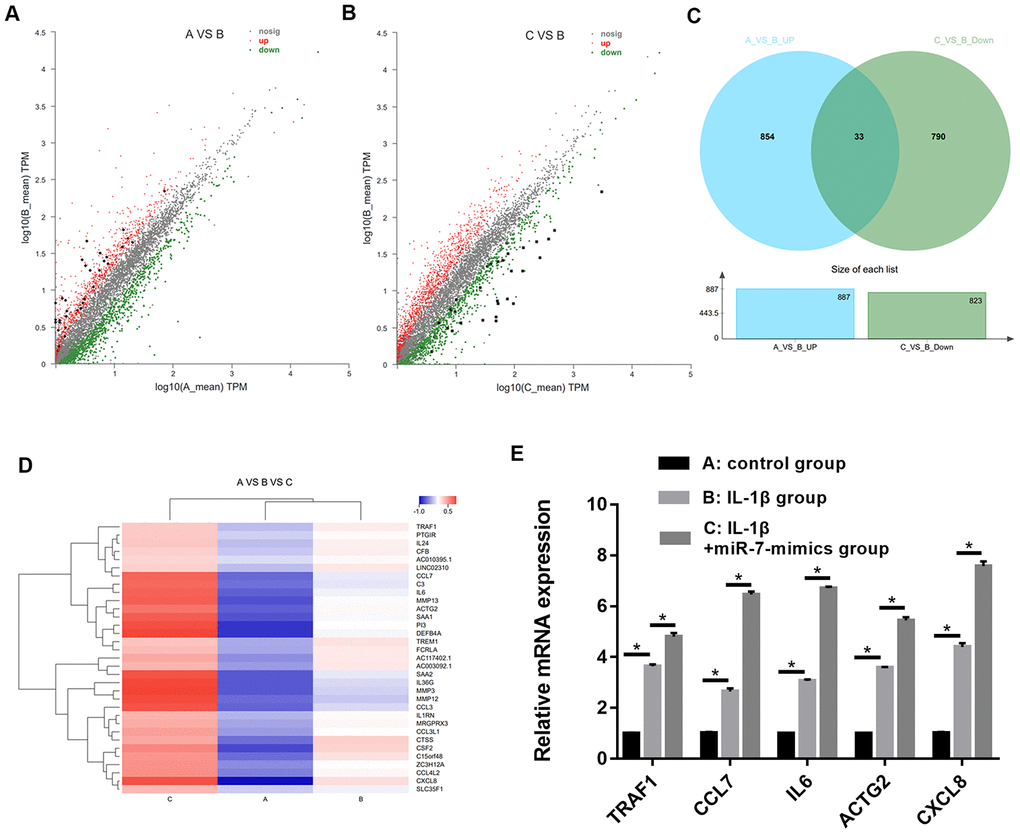
Figure 8.Scatter plot of differential expression of A vs. B (A) and C vs. B (B). Every point in the plot indicates the expression of a gene in the two experiments, and the red and green points in the plot represent the upregulated and downregulated mRNAs with statistical significance, respectively. Black points represent the 33 overlapping mRNAs between the above-mentioned upregulated genes and downregulated genes. The X-axis and Y-axis represent the log10 TPM values in the two experiments, respectively. (C) Venn diagram comparing differentially-expressed genes (DEGs) between A vs B and C vs B. Indicated in the diagram are the numbers of upregulated and downregulated DEGs. (D) Cluster analysis of overlapping genes expressed in groups A, B, and C. (E) RT-PCR results for five random differentially expressed mRNAs (TRAF1, CCL7, IL6, ACTG2, and CXCL8). Data represent the mean ± SD (n=3), * p < 0.05.