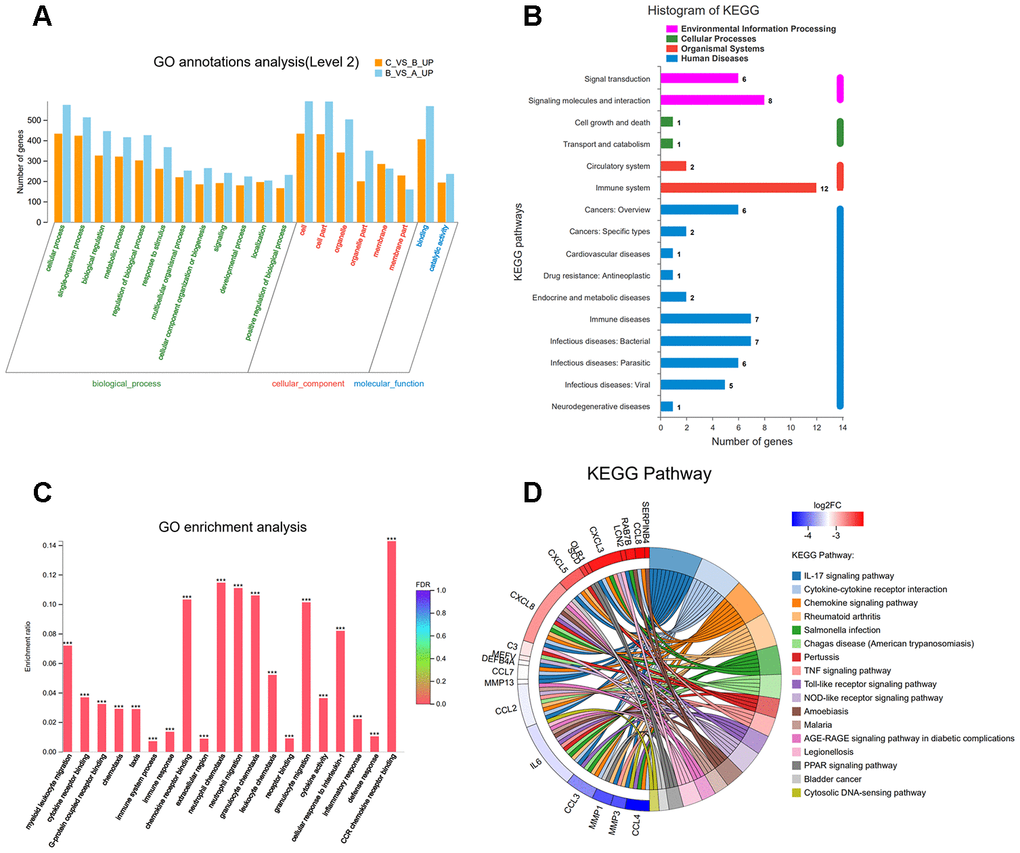
Figure 9.(A) Classification of 33 overlapping genes in accordance with gene ontology (GO) categories: biological process, cellular component, and molecular function; The vertical axis represents numbers of differentially-expressed genes (DEGs) corresponding to the numbers of GO terms assigned for a particular GO category. (B) KEGG pathway analysis identified that KEGG categories were enriched in 33 overlapping genes. (C) GO terms enrichment analysis for 33 overlapping genes. (D) Circos plot showing the relationship between KEGG pathway and their genes. Genes are located on the left side of the graph and indicated by their symbols. Gene involvement in the KEGG pathways is indicated by connecting lines.