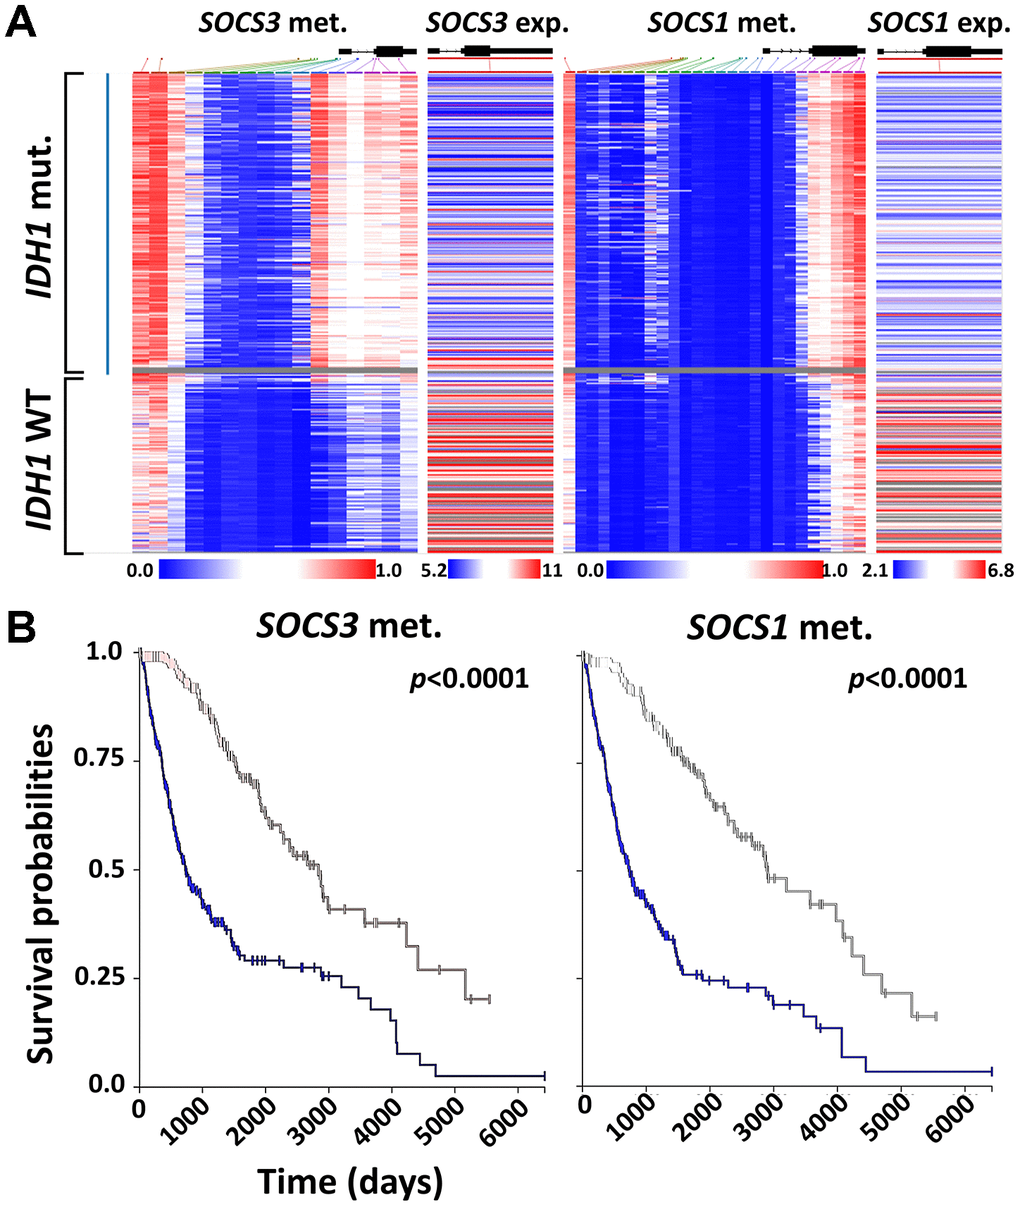
Figure 7.Correlation between SOCS1 and SOCS3 expression and IDH1 mutation. (A) Heatmap analysis of SOCS1 and SOCS3 gene expression, methylation and IDH1 mutation status was achieved using UCSC Xena and TCGA-LGG/GBM datasets (N = 658). The gray area indicates that SOCS3 methylation data is not available for that specific patient’s sample. (B) K-M survival analysis of LGG and GBM patients based on the methylation status of SOCS1 and SOCS3. Blue lines indicate the groups with lower-than-median methylation of SOCS1 and SOCS3.