


Introduction
Glioblastoma multiforme (GBM) is the most common and aggressive tumor of the central nervous system (CNS) in adults [1, 2]. The Central Brain Tumor Registry of the United States reports that the average annual incidence rate of malignant CNS tumors in the United States is 23.41 per 100,000, 48.3% of which are GBM [3]. Rigorous screening algorithms have been used to process genome-wide databases, revealing multiple prognostic transcriptome signatures with no apparent functional interplay [4–9]. Many recent pre-clinical studies have identified the cullin-RING E3 ligase (CRL) complex in the ubiquitin-proteasomal system (UPS) as a promising target for GBM treatment [10–12].
Conjugation of ubiquitin (Ub) in the UPS is achieved through a cascade of three consecutive enzymatic reactions catalyzed by the E1, E2 and E3 enzymes. The E1 ubiquitin-activating enzyme (UAE) activates Ub and catalyzes the covalent transfer of Ub to the E2 Ub-conjugating enzyme. An E3 ligase catalyzes the final step by transferring Ub from E2 to a substrate protein [13]. CRLs polyubiquitinate approximately 20% of cellular proteins degraded via the UPS [13]. The cullin protein forms a central stalk-like scaffold that constrains and positions the substrate binding and adaptor proteins on its N-terminus and the RING-finger containing proteins (Rbx1 or Rbx2) on its C-terminus (Figure 1) [14]. The catalytic centers of CRLs label substrates with a chain of Ubs, earmarking those proteins for proteasome-mediated degradation [14]. Malignant cells often display CRL overactivation, which promotes cell-cycle progression, signaling pathway dysregulation and chemo-/radioresistance [15, 16]. CRL activation requires conjugation of a Ub-like protein called neural precursor cell-expressed developmentally downregulated 8 (NEDD8) near the C-terminus of cullin [17]. NEDD8 conjugation to cullin is also carried out in three stepwise enzymatic reactions. These reactions involve the NEDD8-activating enzyme (NAE; E1N), UBC12 and UBE2F (E2N) and E3N, which transfers NEDD8 to cullin (Figure 1) [17]. Hyperactivation of NEDD8 conjugation predicts poor GBM prognosis [12]. Human cells have 7 different cullin proteins (CUL1, 2, 3, 4A, 4B, 5, 7), and each cullin protein has a corresponding substrate recognition protein, an adaptor protein and a RING-finger containing protein (Figure 1).
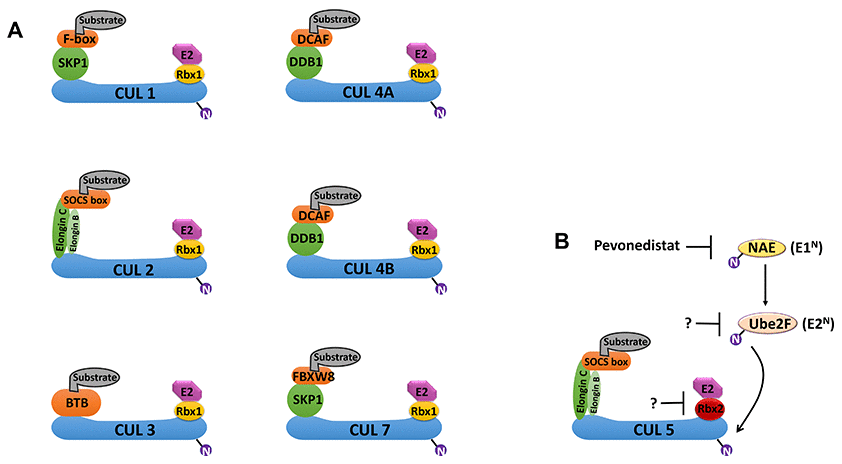
Figure 1. Schematic overview of cullin-RING E3 ligases (CRLs) and the NEDD8 conjugation pathway. (A) Cullin (CUL) proteins form the scaffold of the CRL E3 ligase complexes. CRL1 and CRL7 use SKP1; CRL2 and CRL5 use both Elongin B and Elongin C; CRL4A and CRL4B use DDB1; and CRL3 uses BTB as substrate adaptors. CRL1 uses F-box proteins; CRL4A and CRL4B use DCAF; CRL2 and CRL5 use SOCSs; and CRL7 uses FBXW8 as substrate binding proteins. CRL1-3, 4A/B and 7 use Rbx1; and CRL5 uses Rbx2 as RING-finger proteins. (B) Conjugation of the Ub-like protein NEDD8 to a cullin protein is required for fully activation of the CRL. The conjugation of NEDD8 occurs in three steps: activation by the NEDD8 activation enzyme (NAE; E1N), transference to the E2 enzyme (E2N), and conjugation of NEDD8 to the cullin protein in the CRL. UBE2F is the major E2N needed for NEDD8 conjugation to CRL5. MLN4924 (Pevonedistat) is a first-in-class inhibitor of E1N that can prevent NEDD8 conjugation to CRLs. Abbreviations: Ub, ubiquitin; RING, really interesting new gene; DDB1, DNA damage-binding protein 1; DCAF, DDB1- and CUL4-associated factor; FBXW8, F-box and WD40 domain 8; BTB, broad-complex, tramtrack, and bric-à-brac; SOCS, suppressor of cytokine signaling.
We report here that the expression of the RNF7,TCEB1, SOCS1 and SOCS3 genes, which encode the RING-finger protein Rbx2, the adaptor protein Elongin C and the substrate binding proteins SOCS1 and SOCS3, respectively, are simultaneously upregulated in GBM. Rbx2, Elongin C, SOCS1 and SOCS3 form a specific E3 ligase known as CRL5 (Figure 1). Given the importance of CRLs in GBM progression, the transcriptome signature of CRL5 components may have important GBM grading, diagnostic, prognostic and therapeutic value.
Results
Anatomically mapped differential gene expression patterns of CRLs
The histological dataset from the Ivy Glioblastoma Atlas Project (Ivy GAP) was classified anatomically as leading edge (LE), infiltrating tumor (IT), cellular tumor (CT), pseudopalisading cells around necrosis (PAN) and microvascular proliferation (MVP) based on H&E staining analysis. Expression levels of genes encoding key components of CRLs were mapped in Figure 2A. SKP1, BTBD10, DDB1, TCEB1 and TCEB2 genes encode the adaptor proteins; BTRC, SOCS1, SOCS3, FBXL2/3/5, FBXW7/11 and FBXO9 genes encode the substrate-binding proteins; RBX1 and RNF7 genes encode the RING-finger containing proteins Rbx1 and Rbx2, respectively; and UBB and NEDD8 genes encode Ub and NEDD8, respectively [14]. The expression level of the majority of CRL components was higher at the LE anatomical structure (Figure 2A). The expression levels of SOCS3, RNF7 and RBX1 were higher in the MVP anatomical structure (Figure 2A). SOCS1 and genes encoding all cullin proteins were evenly distributed (Figure 2A and 2B). The ISH data confirmed that SOCS3 expression is higher in perivascular area (Figure 3B). SOCS1 and SOCS3 function in both CRL2 and CRL5 complexes, whereas Rbx2 (encoded by RNF7) is unique in that it mainly functions in the CRL5 complex (Figure 1).
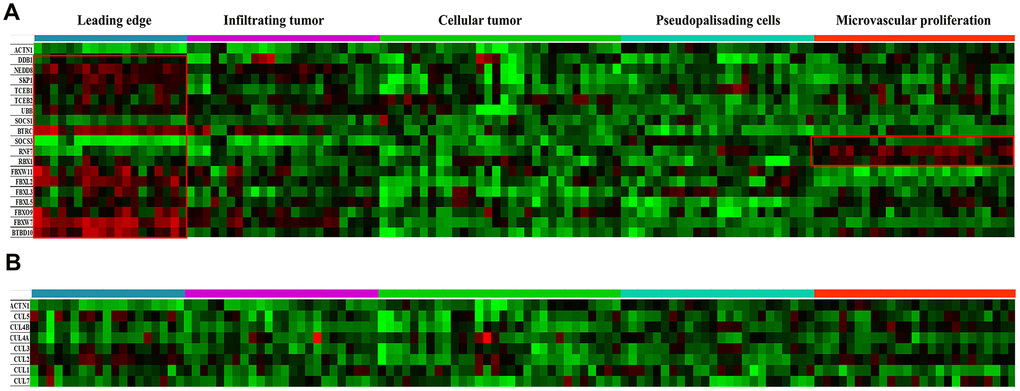
Figure 2. Anatomical mapping of CRL components in GBM clinical samples. (A) Expression levels of major CRL component genes SKP1, TCEB1/2, BTBD10, DDB1, TCEB1, TCEB2, BTRC, SOCS1, SOCS3, FBXL2/3/5, FBXW7/11, FBXO9, RBX1, RNF7, UBB, and NEDD8, were mapped based on the anatomic features of clinical samples. (B) Expression levels of the cullin genes CUL1, CUL2, CUL3, CUL4A, CUL4B, CUL5 and CUL7 were also mapped. The following anatomic structures were identified by H&E staining based on the Ivy GAP dataset: leading edge, infiltrating tumor, cellular tumor, microvascular proliferation and pseudopalisading cells around necrosis. ACTN1 gene expression was used as a reference.
Upregulated expression levels of CRL5 components in GBM
Using the TCGA and GTEx datasets, we compared the differential expression levels of the genes encoding CRL2 and CRL5 in GBM and normal tissues. Expression levels of RNF7, SOCS1 and SOCS3 were significantly higher in GBM tissues than in normal tissues (Figure 3A). However, we did not observe significantly upregulated expression levels of CUL2, CUL5 or RBX1 in GBM tissues compared with those in normal tissues (data not shown).
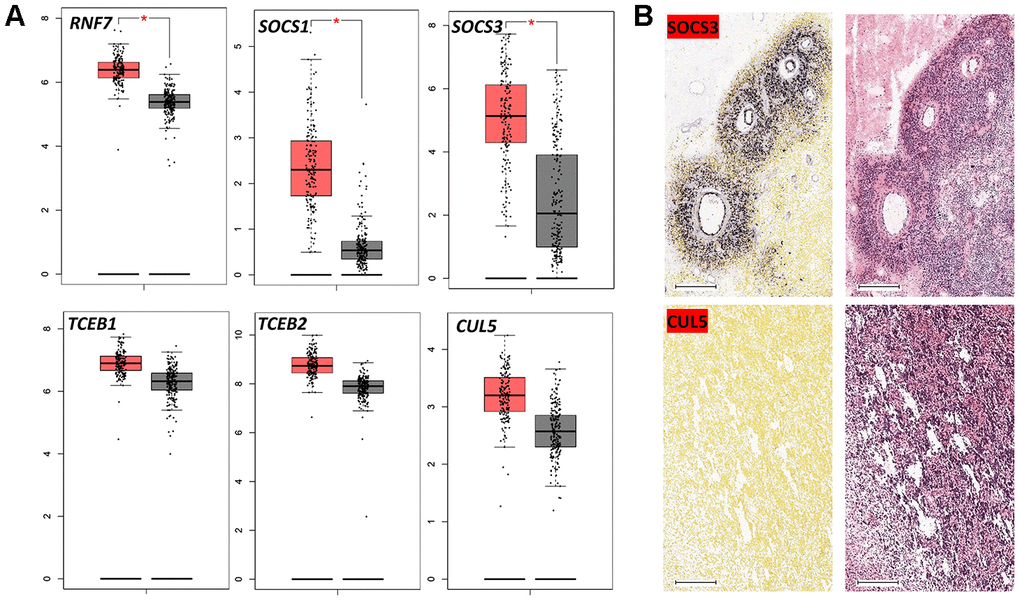
Figure 3. Expression of CRL5 components in GBM. (A) Boxplot data analysis of genes encoding CRL5 components in GBM and normal brain tissues. GEPIA (http://gepia.cancer-pku.cn/) was used to analyze RNA-seq data from malignant and normal tissues (TCGA and GTEx datasets). (B) In situ hybridization of SOCS3 and CUL5 in GBM patients based on the Ivy GAP dataset. * P < 0.01.
The correlation between GBM staging and CRL5 expression
The WHO classification offers primary guidelines for brain tumor grading and treatment. However, the grading system for glioma largely depends on microscopic histological features, because molecular biomarkers are not available [18]. We determined if the expression of CRL5 components was correlated with WHO tumor classification. In the Chinese Glioma Genome Atlas (CGGA) dataset, we found that elevated expression levels of SOCS1, SOCS3, TCEB1, TCEB2 and RNF7 correlated with more advanced WHO grades (grades III and IV) of primary glioma (Figure 4A). The expression levels of CUL5 did not correlate with glioma WHO grades (Figure 4A). We further studied whether the SOCS1, SOCS3, Rbx2, Elongin B and Elongin C proteins form a functional complex. We found that the expression levels of RNF7 correlate with those of TCEB1 and TCEB2, SOCS1, SOCS3, with R values of 0.72, 0.53, 0.42 and 0.52, respectively (Figure 4B). These results indicate that components of CRL5 form a functional protein complex in GBM, and their gene expression levels can be valuable grading biomarkers.
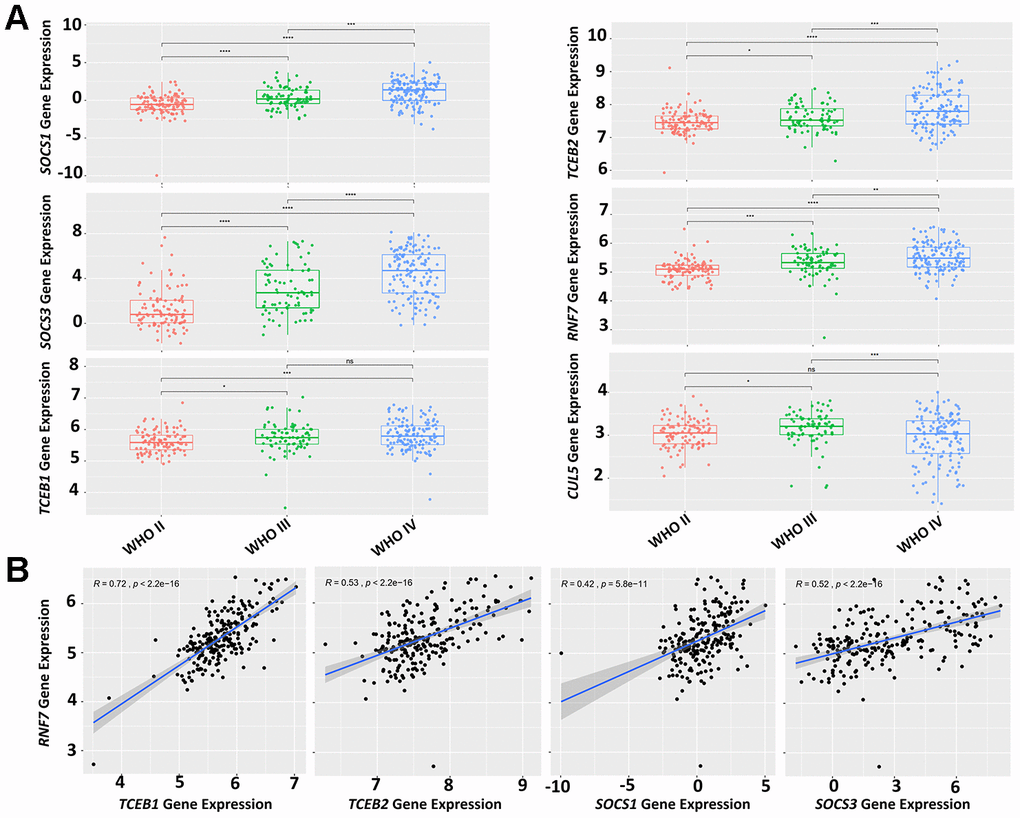
Figure 4. Expression levels of CRL5 components correlate with glioma grading. (A) A CGGA dataset (mRNAseq_325) was used for analysis of CRL5 component gene expression and glioma grading. (B) A CGGA dataset (mRNAseq_325) was used for correlation analysis of gene expression between RNF7 and TCEB1, TCEB2, SOCS1 and SOCS3 with R values of 0.72, 0.53, 0.42, 0.52, respectively. The P values in each pair were all less than 1e-10.
Expression levels of CRL5 components as survival predictors
We also studied the potential of CRL5 as a biomarker in predicting overall survival (OS) rates in patients with GBM and glioma. Patients with primary glioma, WHO grade IV glioma or recurrent glioma were grouped into cohorts based on the median expression levels of CRL components (Figure 5). We found that primary glioma patients with higher-than-median expression levels of either SOCS1, SOCS3 or RNF7 had an unfavorable prognosis compared to those with lower-than-median expression levels (P < 0.0001) (Figure 5). A higher-than-median expression level of SOCS1, SOCS3 or TCEB1 also predicts a poor prognosis for WHO grade-IV glioma patients compared to those with lower-than-median expression (Figure 5). (P values were 0.031, 0.017 and 0.014, respectively). Patients with primary glioma, WHO grade IV glioma, and recurrent glioma in whom SOCS3 expression levels were higher than the median consistently demonstrated unfavorable OS rates compared with those with lower-than-median SOCS3 expression levels (Figure 5). (P values were < 0.0001, 0.027 and 0.017, respectively.) However, TCEB2 expression levels failed to predict WHO grade IV glioma prognosis (data not shown).
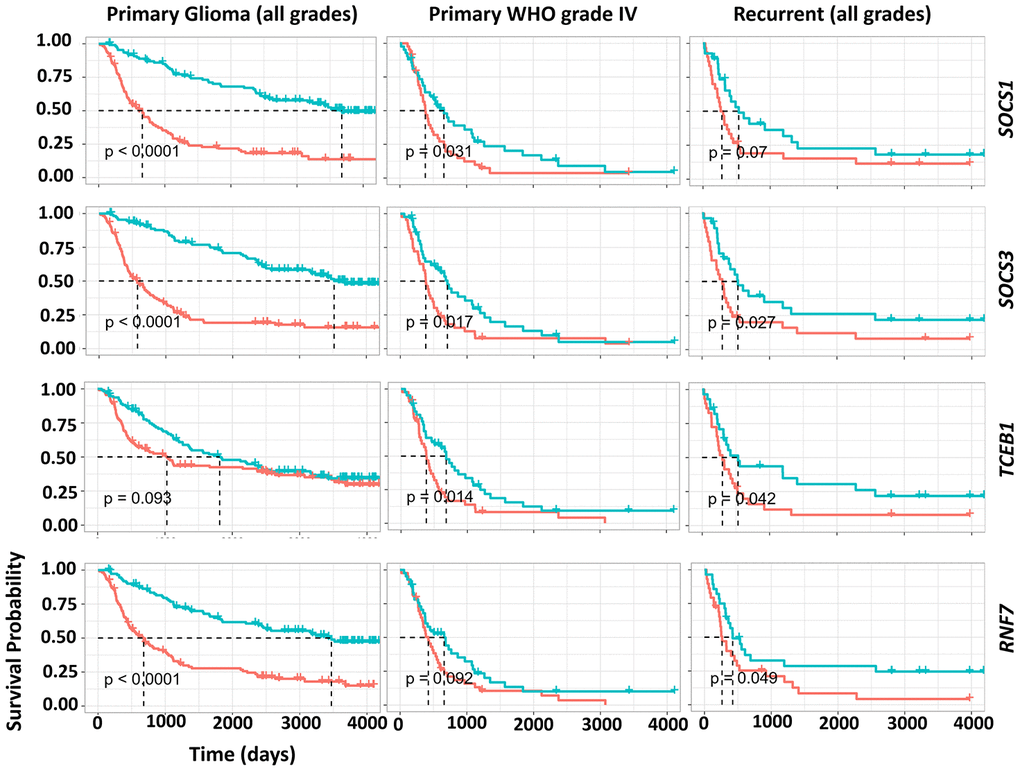
Figure 5. Impact of gene expression of CRL5 components on GBM, primary and recurrent glioma survival. The survival analysis of WHO grade IV, primary and recurrent gliomas was based on a CGGA dataset (mRNAseq_325). P values are indicated in the picture.
A GBM prognosis index (PI) system based on a four-gene signature
Glioma patients harboring an IDHs mutation and 1p/19q co-deletion often have favorable clinical outcomes [19]. Both SOCS1 and SOCS3 in the CRL5 function as substrate-binding proteins that recruit target proteins for Ub conjugation. Due to low basal expression levels of SOCS1 in GBM and the gene’s potential functional overlap with SOCS3, we decided to exclude SOCS1 in our multi-gene analysis for GBM prognosis. SOCS3, RNF7, TCEB1 and TCEB2 are genes encoding key components of the CRL5 complex. These genes were first analyzed on the UCSC Xena tool using an RNA-seq dataset of 172 The Cancer Genome Atlas Glioblastoma Multiforme (TCGA-GBM) patients (https://xena.ucsc.edu/) (Figure 6A). The heatmap analysis confirmed a linear correlation between the selected genes, and a Cox model was warranted to calculate the PI, also known as the risk score (Figure 6A). Verhaak et al. classified GBM into the following four types: classical, mesenchymal, proneural and neural (C, M, P, N) [20]. Using O-6-methylguanine-DNA methyltransferase (MGMT) gene methylation status as a covariate, we evaluated the PI for the four-gene RNA-seq signature in all GBM subclasses of a GBM-BioDP dataset. We found that the four-gene signature had PI values of 1.61, 1.86, 2.71, 3.66 and 3.45 for the full GBM cohort, and the C, M, P and N subclasses, respectively (Figure 6B). Hazard ratio (HR)-based P-value analysis yielded P values of 0.003, 0.048, 0.001, < 0.001 and 0.012 for the full GBM cohort, and the C, M, P and N subclasses, respectively (Figure 6B). These data indicate that the four-gene signature encoding the CRL5 components Elongin B, Elongin C, SOCS3 and Rbx2 can predict the OS of all the GBM subclasses.
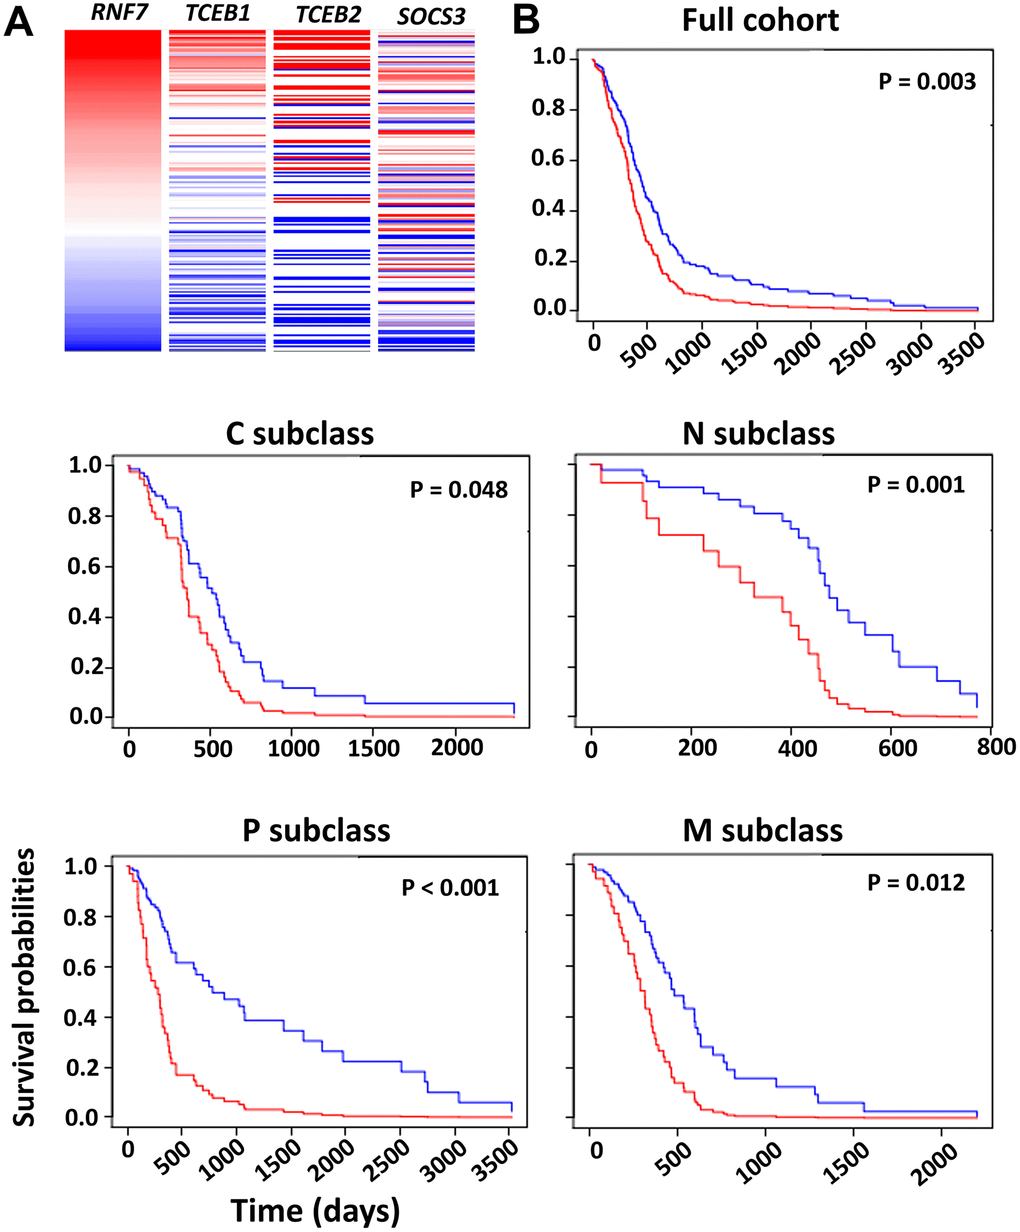
Figure 6. Survival analysis based on the impact of the multi-gene PI. (A) Heatmap analysis of the CRL5 components in TCGA-GBM dataset was conducted using the UCSC Xena tool. (B) Survival analysis based on HR was conducted using the GBM-BioDP portal. GBM tissue was classified into proneural (P), neural (N), classical (C) and mesenchymal (M) subtypes based on gene expression patterns [20]. A Cox proportional hazards model was constructed with gene expression of the CRL5 components, SOCS3, RNF7, TCEB1 and TCEB2. We used O-6-methylguanine-DNA methyltransferase (MGMT) methylation status as a covariate. P values are included in the figure.
Correlation of SOCS1 and SOCS3 expression with IDHs mutations
We demonstrated that elevated expression levels of either SOCS1 or SOCS3 could independently predict poor prognosis of patients with primary glioma or GBM. Recent studies have found that SOCS1 and SOCS3 genes are hypermethylated in various types of cancers [21, 22]. We conducted a heatmap analysis of a cohort of 658 patients in TCGA Low-Grade Glioma and GBM (TCGA-LGG/GBM) dataset (Figure 7A). We found that IDH1 mutation predicts hypermethylation and expression downregulation of SOCS1 and SOCS3 (Figure 7A). Furthermore, patients with hypermethylation of either SOCS1 or SOCS3 have favorable OS rates regardless of treatment regimens (Figure 7B). To study the potential correlation between IDH1 mutation status and SOCS1/SOCS3 expression levels, we identified 7 patients carrying missense/in-frame IDH1 mutations whose SOCS3 expression levels were also available in the TCGA-GBM dataset. All 7 patients with mutated IDH1 had lower-than-median SOCS3 expression levels and promoter hyperme thylation (Supplementary Figure 1). We found that SOCS1 expression levels are not closely related to methylation status in TCGA-GBM dataset (data not shown). Together these data indicate that IDH1 mutations may cause SOCS1 and SOCS3 hyperme thylation and expression downregulation.
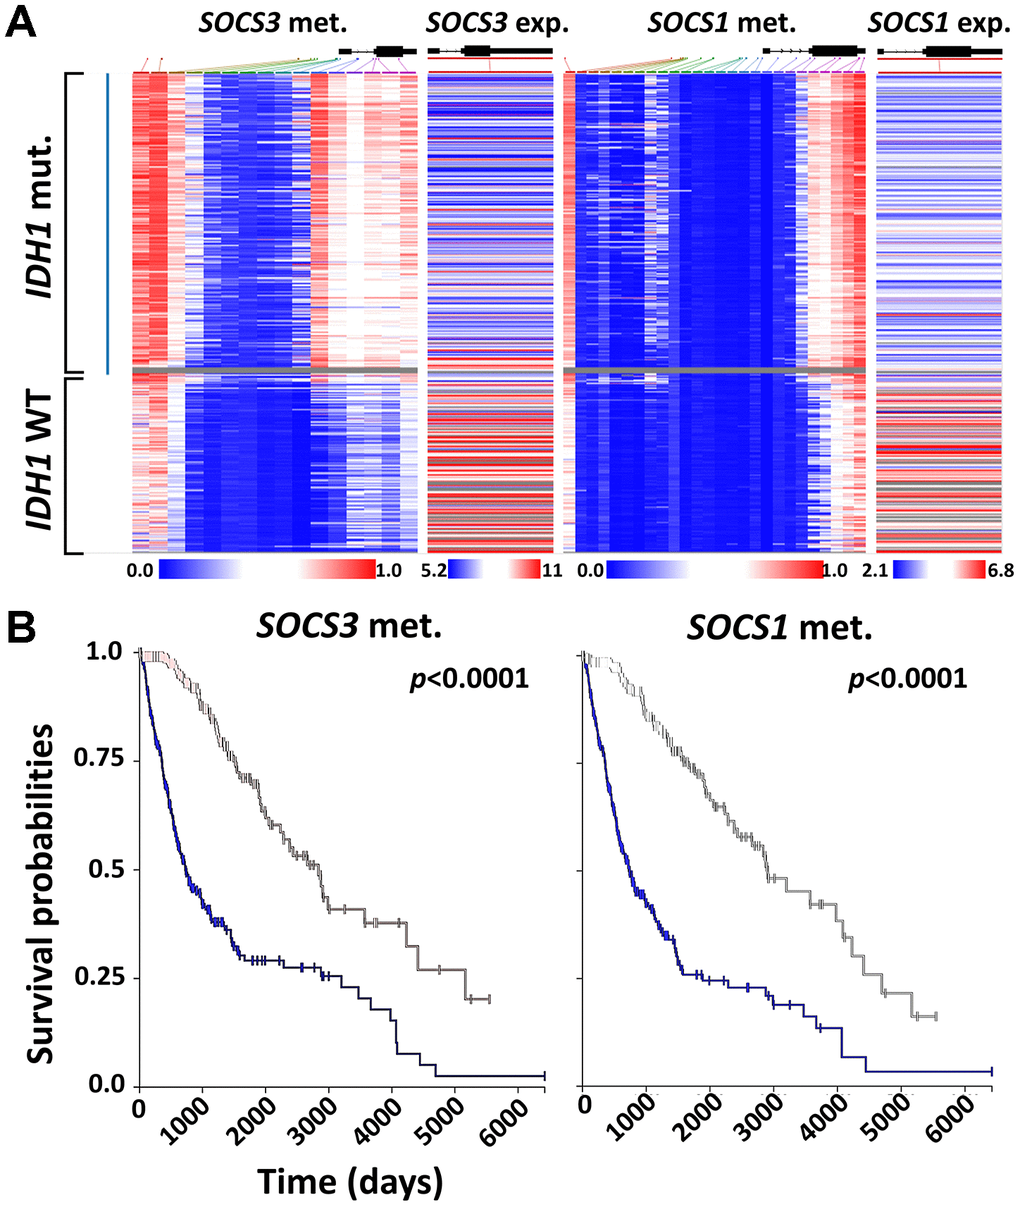
Figure 7. Correlation between SOCS1 and SOCS3 expression and IDH1 mutation. (A) Heatmap analysis of SOCS1 and SOCS3 gene expression, methylation and IDH1 mutation status was achieved using UCSC Xena and TCGA-LGG/GBM datasets (N = 658). The gray area indicates that SOCS3 methylation data is not available for that specific patient’s sample. (B) K-M survival analysis of LGG and GBM patients based on the methylation status of SOCS1 and SOCS3. Blue lines indicate the groups with lower-than-median methylation of SOCS1 and SOCS3.
Discussion
In this study, we demonstrated that overexpression of the CRL5 components Elongin B, Elongin C, SOCS3 and Rbx2 predicts poor prognosis of glioma and all GBM subclasses. We also found that elevated expression levels of TCEB1, TCEB2, SOCS3 or RNF7 correlate with higher glioma grades, providing new molecular parameters for glioma grading. Furthermore, we showed that the transcription of SOCS1 and SOCS3 is downregulated in IDH1-mutated glioma cases via methylation, suggesting IDHs mutations can regulate protein turnover [23]. SOCS1 and SOCS3 mediate degradation of the NF-κB family member p65/RelA, focal adhesion kinase (FAK), von Hippel Lindau (vHL), Janus kinase 2 (JAK2) and indoleamine 2,3-dioxygenase (IDO), all of which play essential roles in GBM progression and chemo-/radioresistance (Table 1) [24–28]. We also employed proteomic studies to show that elevated protein levels of cullin5 were inversely correlated with those of vHL and p65/RelA (Supplementary Figure 2A). We found that CRL5-mediated anti-angiogenic vHL protein downregulation may promote GBM neovascularization, as indicated in our immunohistochemical studies. GBM samples with high-intensity cullin5 staining had more enriched vasculature than those with low cullin5 immunoreactivity (Supplementary Figure 2B). However, upregulated CRL5 activity also mediated degradation of p65/RelA, an important oncogenic transcriptional factor for GBM progression [27].
Table 1. Involvement of cullin5-RING E3 ligase (CRL5) in GBM progression.
| Key Substrates | Pathways | Major functions in GBM | |||||||||||||||||||||||||||||||||||||||||||||||||||||||||||||||||||||||||||||||||||||||||||||||||
| von Hippel–Lindau | VHL/HIF oxygen-sensing | Angiogenesis; invasion; radio-resistance | |||||||||||||||||||||||||||||||||||||||||||||||||||||||||||||||||||||||||||||||||||||||||||||||||
| p65/RelA | NF-κB pathway | Chemo-/radio-resistance | |||||||||||||||||||||||||||||||||||||||||||||||||||||||||||||||||||||||||||||||||||||||||||||||||
| Focal adhesion kinase | Cell adhesion signaling | Chemo-/radio-resistance | |||||||||||||||||||||||||||||||||||||||||||||||||||||||||||||||||||||||||||||||||||||||||||||||||
| Janus kinase 2 | JAK/STAT signaling | Chemo-/radio-resistance | |||||||||||||||||||||||||||||||||||||||||||||||||||||||||||||||||||||||||||||||||||||||||||||||||
| Indoleamine 2,3-dioxygenase | IDO pathway | Immune evasion | |||||||||||||||||||||||||||||||||||||||||||||||||||||||||||||||||||||||||||||||||||||||||||||||||
| VHL, p65/RelA, FAK, JAK2 and IDO are CRL5 substrates. VHL is involved in GBM angiogenesis, invasion and radio-resistance [39]. p65/RelA, FAK and JAK2 are critical in mediating GBM chemo-/radio-resistance [26, 40]. IDO is mainly involved in GBM immune evasion [25]. Abbreviations: FAK, focal adhesion kinase; JAK2, Janus kinase 2; IDO, indoleamine 2,3-dioxygenase; STAT, signal transducer and activator of transcription; vHL, von Hippel-Lindau. | |||||||||||||||||||||||||||||||||||||||||||||||||||||||||||||||||||||||||||||||||||||||||||||||||||
CRL5-independent activities of SOCS3 involve mitogen-activated protein kinase (MAPK) pathway activation, as well as JAK-signal transducer and activator of transcription (STAT) pathway inhibition [29, 30]. Our gene expression heatmap analysis showed that SOCS3 expression levels correlate poorly with those of RNF7, TCEB1 and TCEB2 in GBM samples. Also, SOCS3 expression was clustered around capillaries, whereas CUL5 expression was evenly distributed (Figures 2A and 3B). This pattern of distribution is consistent with previous studies suggesting the upregulation of SOCS3 transcription levels in areas with higher O2 saturation [29].
Our study suggests that strategies targeting CRL5 may curb GBM progression. CRL5 activation requires conjugation of a Ub-like small peptide called NEDD8 at the C-terminus of cullin5. This conjugation is mediated by the coordinated action of enzymes such as NAE and E2N (Figure 1). Inhibition of NAE using the first-in-class inhibitor MLN4924 can downregulate CRL5 activity. However, ubiquitination of oncogenic proteins such as HIF-1α, β-catenin and Mcl-1 is also carried out by CRLs. Therefore, inhibition of NEDD8 conjugation will lead to the stabilization of these oncogenic substrates, highlighting the necessity of developing CRL5-specific inhibitors for potential therapeutic management of GBM [31–36]. Unfortunately, due to a lack of druggable pockets, CRL complexes are difficult to target pharmaceutically [37]. Two E2Ns, UBC12 (also known as UBE2M) and UBE2F, are found in mammalian cells. UBC12 interacts with Rbx1 to mediate the neddylation of cullin1-4, and UBE2F pairs with Rbx2 to facilitate the neddylation of cullin5 [38]. Therefore, inhibition of UBE2F and Rbx2 will eradicate NEDD8 conjugation to cullin5, offering a strategy to specifically target CRL5 without interfering with other CRLs (Figure 1).
Materials and Methods
Public datasets
The primary databases of samples were derived from The Cancer Genome Atlas Glioblastoma Multiforme (TCGA-GBM) and the Chinese Glioma Genome Atlas Network (CGGA) [41]. The primary clinicopathological samples with anatomic transcriptional atlases were derived from the Ivy Glioblastoma Atlas Project (Ivy GAP) [42]. All samples were collected with informed consent. TCGA-GBM provided information from 206 GBM patients on copy number variation, RNA-seq and DNA methylation. The CGGA dataset provided grading, RNA-seq and DNA methylation information from 1,962 glioma patients. The TCGA Low-Grade Glioma and GBM (TCGA-LGG/GBM) dataset provided information from 1,153 patients on DNA methylation, RNA-seq and isocitrate dehydrogenases (IDHs). Expression levels of genes in normal tissue were derived from the Genotype-Tissue Expression (GTEx) project (https://www.gtexportal.org/home/).
Anatomical mapping of CRL components
The Ivy GAP dataset has a 41-patient cohort whose tumor samples were evaluated based on anatomic features classified as leading edge (LE), infiltrating tumor (IT), cellular tumor (CT), pseudopalisading cells around necrosis (PAN) and microvascular proliferation (MVP). Classification of these anatomic features was carried out using hematoxylin and eosin (H&E) staining. Genes encoding major CRLs components including SKP1, BTBD10, DDB1, TCEB1, TCEB2, BTRC, SOCS1, SOCS3, FBXL2/3/5, FBXW7/11, FBXO9, RBX1, RNF7, UBB, NEDD8, CUL1, CUL2, CUL3, CUL4A, CUL4B, CUL5 and CUL7 were included. ACTN1 gene expression was used as a reference. In situ hybridization (ISH) for CUL5 and SOCS3 were also derived from the Ivy GAP dataset.
Kaplan-Meier(K-M) survival analysis
K-M survival analyses for primary glioma of all grades, World Health Organization (WHO) grade IV and recurrent glioma were derived from the CGGA data (mRNAseq_325). Cohorts with sample sizes of 224, 85 and 57 were included for overall survival (OS) analysis of primary, WHO grade IV and recurrent gliomas. Median expression levels of the SOCS1, SOCS3, RNF7, TCEB1 and TCEB2 genes were used as cutoffs for classification of patients with lower-than-median and higher-than-median expression levels in each group of analysis. A log-rank test was used for calculations of P values.
Immunohistochemistry (IHC) and proteomic analysis
The Human Protein Atlas provides immunehistochemical analysis of cullin5 expression in GBM samples (https://www.proteinatlas.org/). The IHC study was carried out using anti-cullin5 antibody (HPA002185) Sigma-Aldrich (MO, USA). The antibody reliability is validated for IHC study by assessing staining pattern in 44 normal tissues (https://www.proteinatlas.org/ENSG00000166266-CUL5/antibody). A total of 6 GBM cases were included in the study. Proteomic data used in this publication was generated by the National Cancer Institute Clinical Proteomic Tumor Analysis Consortium (https://cptac-data-portal.georgetown.edu/) (N = 99). Mass spectrometry analysis was conducted using the 11-plexed isobaric tandem mass tags (TMT-11). Protein abundance was presented as log2-ratio of the expression of the sample to a normal control. GBM cases were aligned with decreasing cullin5 protein levels. Corresponding levels of von Hippel Lindau (vHL), p65/RelA, focal adhesion kinase (FAK) and Janus kinase 2 (JAK2) proteins from those aligned cases were color-coded in the heatmap analysis. The color red represents the samples with the 20% with the highest protein levels and color green represents those the 20% with the lowest protein levels.
Multi-gene prognostic index analysis
Survival analysis based on the impact of the multi-gene prognostic index (PI) was conducted on the GBM-BioDP website (https://gbm-biodp.nci.nih.gov/) using the Verhaak 840 Core experiment setting [20]. Briefly, GBM was classified into proneural (P), neural (N), classical (C) and mesenchymal (M) subtypes based on gene expression patterns [20]. A Cox proportional hazards model was constructed using the gene expression levels of SOCS3, RNF7, TCEB1, TCEB2 and O-6-methylguanine-DNA methyltransferase (MGMT) methylation status as covariates.
Statistical analysis
Statistical analysis was performed using GraphPad Prism 6.0 software. Pearson correlation analysis between RNF7 and TCEB1,TCEB2, SOCS1 and SOCS3 expression levels in primary glioma was carried out automatically in the CGGA dataset. All statistical tests were 2-sided, and P values less than 0.05 were considered statistically significant.
Supplementary Materials
Author Contributions
S.H.Z., and Z.H.L. performed the experiments, wrote the manuscript, and analyzed data, S.H.Z. conceived the ideas, and all authors read and approved the final version of the manuscript.
Conflicts of Interest
The authors declare no conflicts of interest.
Funding
This work was supported by the Zhejiang Key Agricultural Enterprise Institute (2017Y20001).
References
- 1. Lee JH, Jung TY, Jung S, Kim IY, Jang WY, Moon KS, Jeong EH. Performance status during and after radiotherapy plus concomitant and adjuvant temozolomide in elderly patients with glioblastoma multiforme. J Clin Neurosci. 2013; 20:503–08. https://doi.org/10.1016/j.jocn.2012.03.044 [PubMed]
- 2. Komotar RJ, Otten ML, Moise G, Connolly ES
Jr . Radiotherapy plus concomitant and adjuvant temozolomide for glioblastoma-a critical review. Clin Med Oncol. 2008; 2:421–22. https://doi.org/10.4137/cmo.s390 [PubMed] - 3. Ostrom QT, Cioffi G, Gittleman H, Patil N, Waite K, Kruchko C, Barnholtz-Sloan JS. CBTRUS statistical report: primary brain and other central nervous system tumors diagnosed in the United States in 2012-2016. Neuro Oncol. 2019 (Suppl 5); 21:v1–100. https://doi.org/10.1093/neuonc/noz150 [PubMed]
- 4. Gao WZ, Guo LM, Xu TQ, Yin YH, Jia F. Identification of a multidimensional transcriptome signature for survival prediction of postoperative glioblastoma multiforme patients. J Transl Med. 2018; 16:368. https://doi.org/10.1186/s12967-018-1744-8 [PubMed]
- 5. Zuo S, Zhang X, Wang L. A RNA sequencing-based six-gene signature for survival prediction in patients with glioblastoma. Sci Rep. 2019; 9:2615. https://doi.org/10.1038/s41598-019-39273-4 [PubMed]
- 6. Yin W, Tang G, Zhou Q, Cao Y, Li H, Fu X, Wu Z, Jiang X. Expression profile analysis identifies a novel five-gene signature to improve prognosis prediction of glioblastoma. Front Genet. 2019; 10:419. https://doi.org/10.3389/fgene.2019.00419 [PubMed]
- 7. Hou Z, Yang J, Wang H, Liu D, Zhang H. A potential prognostic gene signature for predicting survival for glioblastoma patients. Biomed Res Int. 2019; 2019:9506461. https://doi.org/10.1155/2019/9506461 [PubMed]
- 8. Zhang Y, Xu J, Zhu X. A 63 signature genes prediction system is effective for glioblastoma prognosis. Int J Mol Med. 2018; 41:2070–78. https://doi.org/10.3892/ijmm.2018.3422 [PubMed]
- 9. Yang H, Jin L, Sun X. A thirteen-gene set efficiently predicts the prognosis of glioblastoma. Mol Med Rep. 2019; 19:1613–21. https://doi.org/10.3892/mmr.2019.9801 [PubMed]
- 10. Zhou S, Zhao X, Yang Z, Yang R, Chen C, Zhao K, Wang W, Ma Y, Zhang Q, Wang X. Neddylation inhibition upregulates PD-L1 expression and enhances the efficacy of immune checkpoint blockade in glioblastoma. Int J Cancer. 2019; 145:763–74. https://doi.org/10.1002/ijc.32379 [PubMed]
- 11. Han S, Shin H, Oh JW, Oh YJ, Her NG, Nam DH. The protein neddylation inhibitor MLN4924 suppresses patient-derived glioblastoma cells via inhibition of ERK and AKT signaling. Cancers (Basel). 2019; 11:1849. https://doi.org/10.3390/cancers11121849 [PubMed]
- 12. Hua W, Li C, Yang Z, Li L, Jiang Y, Yu G, Zhu W, Liu Z, Duan S, Chu Y, Yang M, Zhang Y, Mao Y, Jia L. Suppression of glioblastoma by targeting the overactivated protein neddylation pathway. Neuro Oncol. 2015; 17:1333–43. https://doi.org/10.1093/neuonc/nov066 [PubMed]
- 13. Pohl C, Dikic I. Cellular quality control by the ubiquitin-proteasome system and autophagy. Science. 2019; 366:818–22. https://doi.org/10.1126/science.aax3769 [PubMed]
- 14. Skaar JR, Pagan JK, Pagano M. Mechanisms and function of substrate recruitment by f-box proteins. Nat Rev Mol Cell Biol. 2013; 14:369–81. https://doi.org/10.1038/nrm3582 [PubMed]
- 15. Fouad S, Wells OS, Hill MA, D’Angiolella V. Cullin ring ubiquitin ligases (CRLs) in cancer: responses to ionizing radiation (IR) treatment. Front Physiol. 2019; 10:1144. https://doi.org/10.3389/fphys.2019.01144 [PubMed]
- 16. Zhao Y, Sun Y. cullin-RING ligases as attractive anti-cancer targets. Curr Pharm Des. 2013; 19:3215–25. https://doi.org/10.2174/13816128113199990300 [PubMed]
- 17. Pan ZQ, Kentsis A, Dias DC, Yamoah K, Wu K. Nedd8 on cullin: building an expressway to protein destruction. Oncogene. 2004; 23:1985–97. https://doi.org/10.1038/sj.onc.1207414 [PubMed]
- 18. Gupta A, Dwivedi T. A simplified overview of world health organization classification update of central nervous system tumors 2016. J Neurosci Rural Pract. 2017; 8:629–41. https://doi.org/10.4103/jnrp.jnrp_168_17 [PubMed]
- 19. Yan H, Parsons DW, Jin G, McLendon R, Rasheed BA, Yuan W, Kos I, Batinic-Haberle I, Jones S, Riggins GJ, Friedman H, Friedman A, Reardon D, et al. IDH1 and IDH2 mutations in gliomas. N Engl J Med. 2009; 360:765–73. https://doi.org/10.1056/NEJMoa0808710 [PubMed]
- 20. Verhaak RG, Hoadley KA, Purdom E, Wang V, Qi Y, Wilkerson MD, Miller CR, Ding L, Golub T, Mesirov JP, Alexe G, Lawrence M, O'Kelly M, et al. Integrated genomic analysis identifies clinically relevant subtypes of glioblastoma characterized by abnormalities in PDGFRA, IDH1, EGFR, and NF1. Cancer Cell. 2010; 17:98–110. https://doi.org/10.1016/j.ccr.2009.12.020 [PubMed]
- 21. Feng Y, Wang Z, Bao Z, Yan W, You G, Wang Y, Hu H, Zhang W, Zhang Q, Jiang T. SOCS3 promoter hypermethylation is a favorable prognosticator and a novel indicator for G-CIMP-positive GBM patients. PLoS One. 2014; 9:e91829. https://doi.org/10.1371/journal.pone.0091829 [PubMed]
- 22. Jiang BG, Wang N, Huang J, Yang Y, Sun LL, Pan ZY, Zhou WP. Tumor SOCS3 methylation status predicts the treatment response to TACE and prognosis in HCC patients. Oncotarget. 2017; 8:28621–27. https://doi.org/10.18632/oncotarget.16157 [PubMed]
- 23. Lamsoul I, Uttenweiler-Joseph S, Moog-Lutz C, Lutz PG. Cullin 5-RING E3 ubiquitin ligases, new therapeutic targets? Biochimie. 2016; 122:339–47. https://doi.org/10.1016/j.biochi.2015.08.003 [PubMed]
- 24. Wang J, Yao L, Zhao S, Zhang X, Yin J, Zhang Y, Chen X, Gao M, Ling EA, Hao A, Li G. Granulocyte-colony stimulating factor promotes proliferation, migration and invasion in glioma cells. Cancer Biol Ther. 2012; 13:389–400. https://doi.org/10.4161/cbt.19237 [PubMed]
- 25. Hanihara M, Kawataki T, Oh-Oka K, Mitsuka K, Nakao A, Kinouchi H. Synergistic antitumor effect with indoleamine 2,3-dioxygenase inhibition and temozolomide in a murine glioma model. J Neurosurg. 2016; 124:1594–601. https://doi.org/10.3171/2015.5.JNS141901 [PubMed]
- 26. Mukthavaram R, Ouyang X, Saklecha R, Jiang P, Nomura N, Pingle SC, Guo F, Makale M, Kesari S. Effect of the JAK2/STAT3 inhibitor SAR317461 on human glioblastoma tumorspheres. J Transl Med. 2015; 13:269. https://doi.org/10.1186/s12967-015-0627-5 [PubMed]
- 27. Friedmann-Morvinski D, Narasimamurthy R, Xia Y, Myskiw C, Soda Y, Verma IM. Targeting NF-κB in glioblastoma: a therapeutic approach. Sci Adv. 2016; 2:e1501292. https://doi.org/10.1126/sciadv.1501292 [PubMed]
- 28. Pozzebon ME, Varadaraj A, Mattoscio D, Jaffray EG, Miccolo C, Galimberti V, Tommasino M, Hay RT, Chiocca S. BC-box protein domain-related mechanism for VHL protein degradation. Proc Natl Acad Sci USA. 2013; 110:18168–73. https://doi.org/10.1073/pnas.1311382110 [PubMed]
- 29. Zhou H, Miki R, Eeva M, Fike FM, Seligson D, Yang L, Yoshimura A, Teitell MA, Jamieson CA, Cacalano NA. Reciprocal regulation of SOCS 1 and SOCS3 enhances resistance to ionizing radiation in glioblastoma multiforme. Clin Cancer Res. 2007; 13:2344–53. https://doi.org/10.1158/1078-0432.CCR-06-2303 [PubMed]
- 30. Ventero MP, Fuentes-Baile M, Quereda C, Perez-Valeciano E, Alenda C, Garcia-Morales P, Esposito D, Dorado P, Manuel Barbera V, Saceda M. Radiotherapy resistance acquisition in glioblastoma. Role of SOCS1 and SOCS3. PLoS One. 2019; 14:e0212581. https://doi.org/10.1371/journal.pone.0212581 [PubMed]
- 31. Nager M, Bhardwaj D, Cantí C, Medina L, Nogués P, Herreros J. Β-catenin signalling in glioblastoma multiforme and glioma-initiating cells. Chemother Res Pract. 2012; 2012:192362. https://doi.org/10.1155/2012/192362 [PubMed]
- 32. Emanuele MJ, Elia AE, Xu Q, Thoma CR, Izhar L, Leng Y, Guo A, Chen YN, Rush J, Hsu PW, Yen HC, Elledge SJ. Global identification of modular cullin-RING ligase substrates. Cell. 2011; 147:459–74. https://doi.org/10.1016/j.cell.2011.09.019 [PubMed]
- 33. Fu Y, Zheng S, Zheng Y, Huang R, An N, Liang A, Hu C. Glioma derived isocitrate dehydrogenase-2 mutations induced up-regulation of HIF-1α and β-catenin signaling: possible impact on glioma cell metastasis and chemo-resistance. Int J Biochem Cell Biol. 2012; 44:770–75. https://doi.org/10.1016/j.biocel.2012.01.017 [PubMed]
- 34. Kaur B, Khwaja FW, Severson EA, Matheny SL, Brat DJ, Van Meir EG. Hypoxia and the hypoxia-inducible-factor pathway in glioma growth and angiogenesis. Neuro Oncol. 2005; 7:134–53. https://doi.org/10.1215/S1152851704001115 [PubMed]
- 35. Inuzuka H, Shaik S, Onoyama I, Gao D, Tseng A, Maser RS, Zhai B, Wan L, Gutierrez A, Lau AW, Xiao Y, Christie AL, Aster J, et al. SCF(FBW7) regulates cellular apoptosis by targeting MCL1 for ubiquitylation and destruction. Nature. 2011; 471:104–09. https://doi.org/10.1038/nature09732 [PubMed]
- 36. Day BW, Stringer BW, Spanevello MD, Charmsaz S, Jamieson PR, Ensbey KS, Carter JC, Cox JM, Ellis VJ, Brown CL, Walker DG, Inglis PL, Allan S, et al. ELK4 neutralization sensitizes glioblastoma to apoptosis through downregulation of the anti-apoptotic protein mcl-1. Neuro Oncol. 2011; 13:1202–12. https://doi.org/10.1093/neuonc/nor119 [PubMed]
- 37. Huang X, Dixit VM. Drugging the undruggables: exploring the ubiquitin system for drug development. Cell Res. 2016; 26:484–98. https://doi.org/10.1038/cr.2016.31 [PubMed]
- 38. Huang DT, Ayrault O, Hunt HW, Taherbhoy AM, Duda DM, Scott DC, Borg LA, Neale G, Murray PJ, Roussel MF, Schulman BA. E2-RING expansion of the NEDD8 cascade confers specificity to cullin modification. Mol Cell. 2009; 33:483–95. https://doi.org/10.1016/j.molcel.2009.01.011 [PubMed]
- 39. Lo Dico A, Martelli C, Diceglie C, Lucignani G, Ottobrini L. Hypoxia-inducible factor-1α activity as a switch for glioblastoma responsiveness to temozolomide. Front Oncol. 2018; 8:249. https://doi.org/10.3389/fonc.2018.00249 [PubMed]
- 40. Golubovskaya VM, Huang G, Ho B, Yemma M, Morrison CD, Lee J, Eliceiri BP, Cance WG. Pharmacologic blockade of FAK autophosphorylation decreases human glioblastoma tumor growth and synergizes with temozolomide. Mol Cancer Ther. 2013; 12:162–72. https://doi.org/10.1158/1535-7163.MCT-12-0701 [PubMed]
- 41. Zhao Z, Meng F, Wang W, Wang Z, Zhang C, Jiang T. Comprehensive RNA-seq transcriptomic profiling in the Malignant progression of gliomas. Sci Data. 2017; 4:170024. https://doi.org/10.1038/sdata.2017.24 [PubMed]
- 42. Puchalski RB, Shah N, Miller J, Dalley R, Nomura SR, Yoon JG, Smith KA, Lankerovich M, Bertagnolli D, Bickley K, Boe AF, Brouner K, Butler S, et al. An anatomic transcriptional atlas of human glioblastoma. Science. 2018; 360:660–63. https://doi.org/10.1126/science.aaf2666 [PubMed]