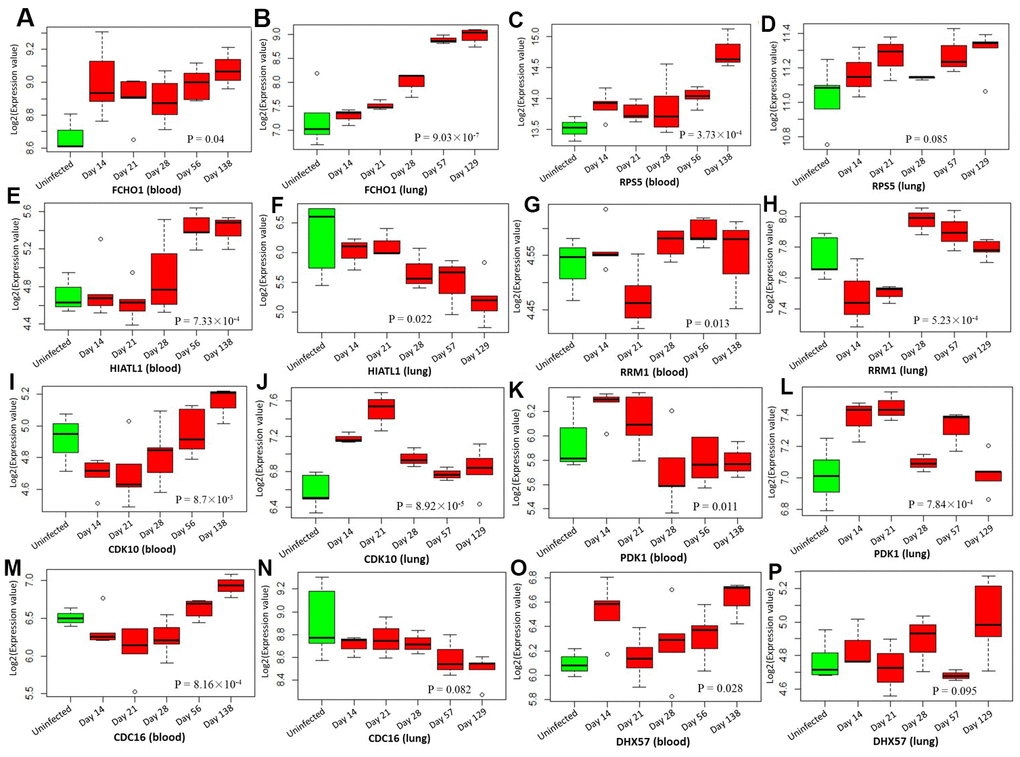
Figure 7.Boxplots show the differential expression levels of tuberculosis-risk genes between uninfected mice and infected mice with 5 distinct time points based on two GSE1440943 (blood) and GSE1440944 (lung) datasets. (A) FCHO1 for blood; (B) FCHO1 for lung; (C) RPS5 for blood; (D) RPS5 for lung; (E) HIATL1 for blood; (F) HIATL1 for lung; (G) RRM1 for blood; (H) RRM1 for lung; (I) CDK10 for blood; (J) CDK10 for lung; (K) PDK1 for blood; (L) PDK1 for lung; (M) CDC16 for blood; (N) CDC16 for lung; (O) DHX57 for blood; (P) DHX57 for lung. P values were generated by Anova test.