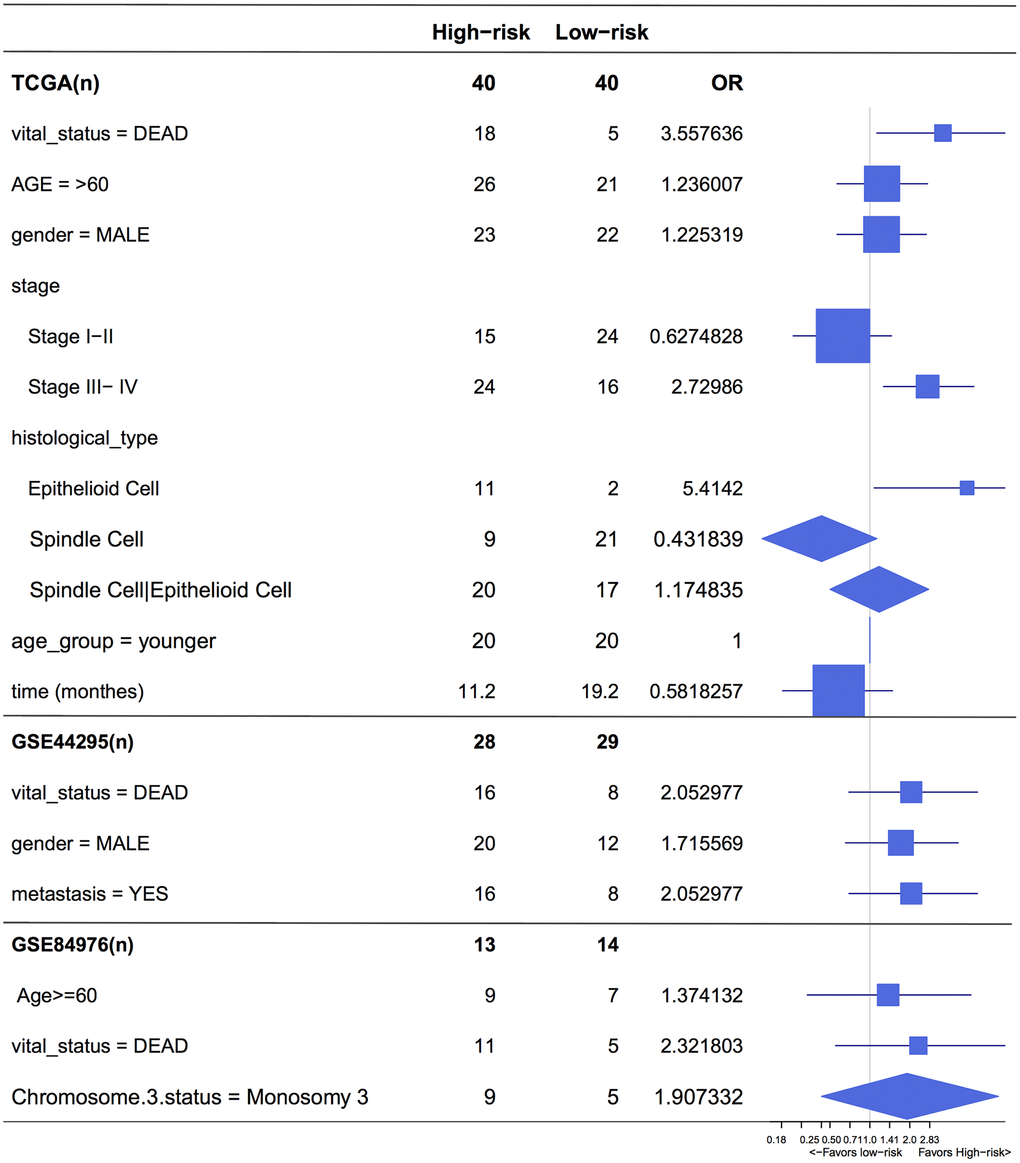
Figure 6.Forest plot for the odds ratio (OR) of high or low 4-cell-type model related risk groups. The length of the horizontal line corresponds to the confidence interval, and the size of the OR data marker is inversely proportional to the confidence interval. The vertical dotted line indicates OR of 1.0.