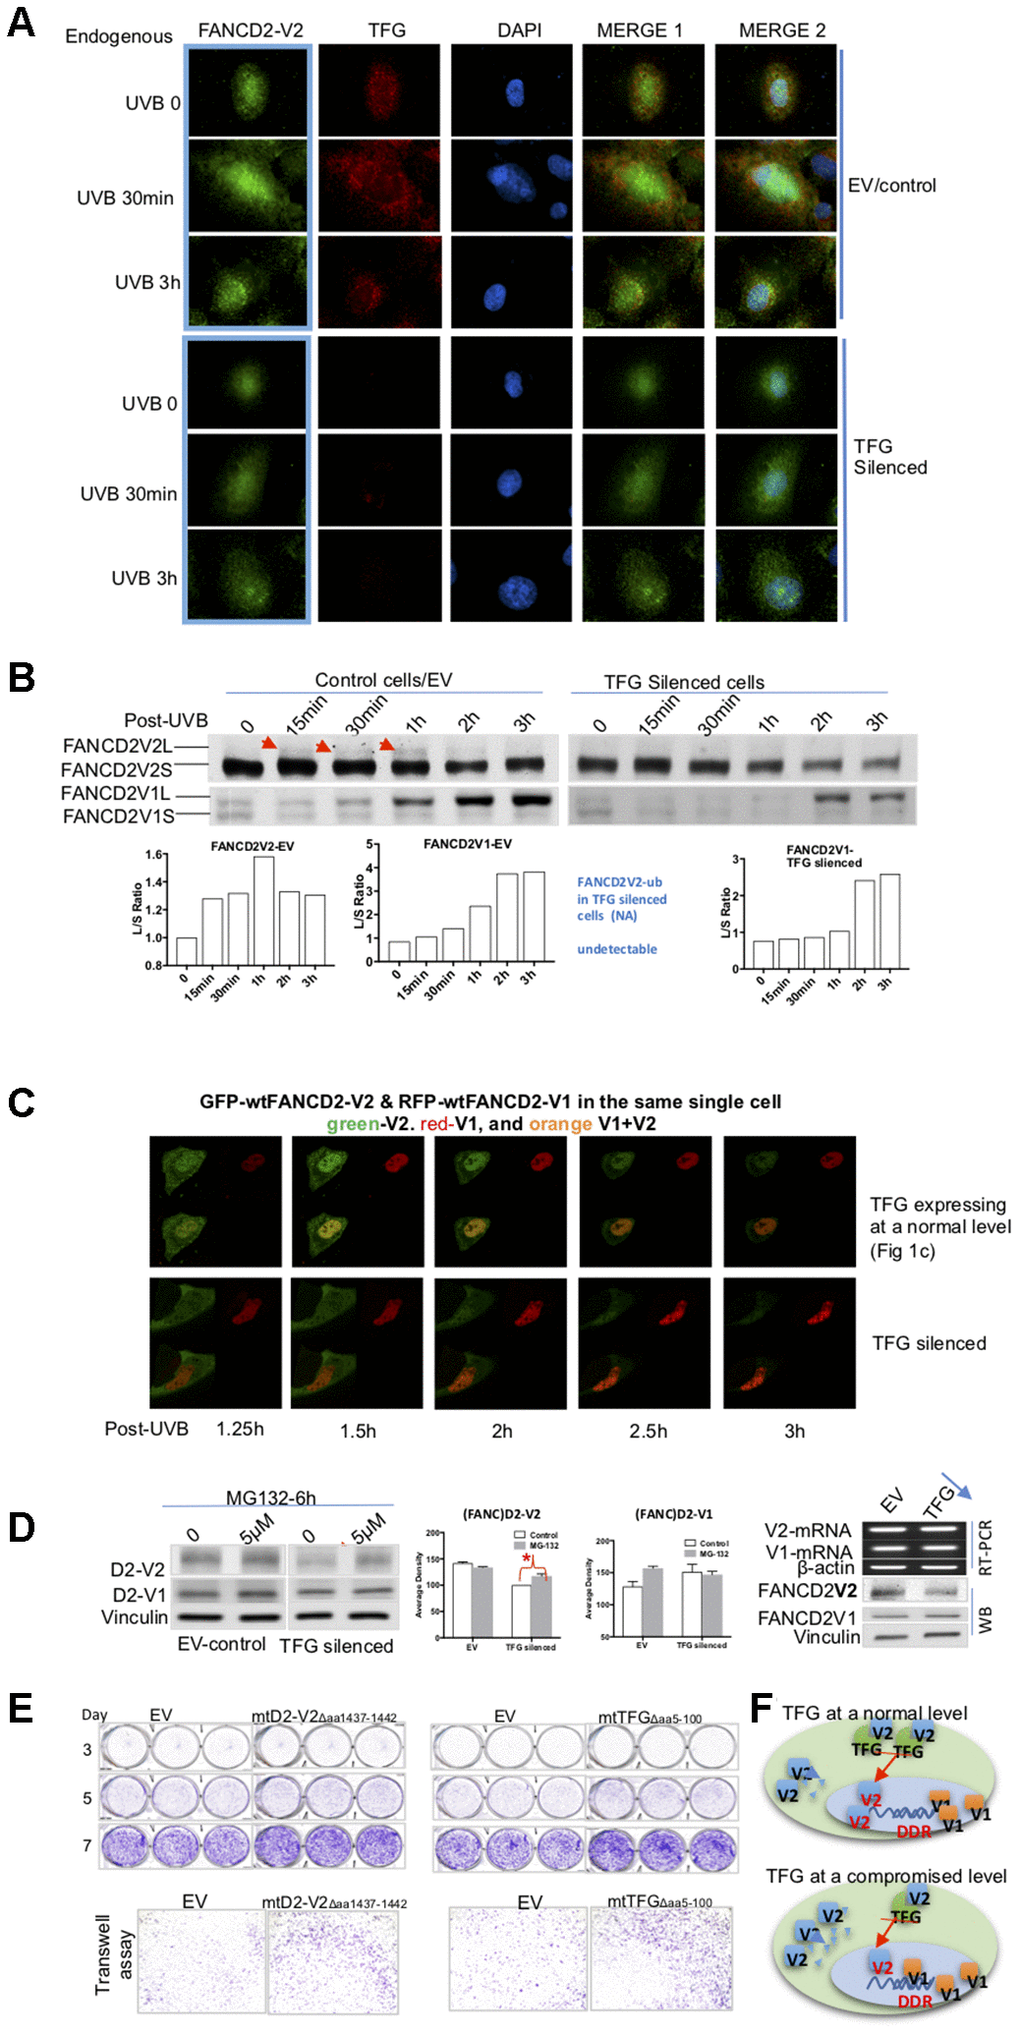
Figure 4.TFG assists biologic properties of FANCD2-V2 through maintaining its protein steady-state level. (A) TFG maintains the earlier peak concentration of FANCD2-V2 in the stressed cells. Both empty vector control and TFG compromised cells were fixed post UVB treatment for 30min, 3h or untreated for 0 min. Anti-FANCD2-V2 and anti-TFG antibodies were used for primary incubation; and anti-Rabbit-Alexa 488 and anti-mouse-Alexa 568 were used for detection of green (FANCD2-V2) and red (TFG) fluorescence respectively. Green fluorescent intensity is lower in TFG-compromised cells (dim red fluorescence) compared to the cells expressing a normal level of TFG (bright red). Blue fluorescence (DAPI) indicates the nucleus of each individual cell. (B) Compromised expression of TFG interferes the peak level of activated FANCD2-V2, but not FANCD2-V1. Nuclear extracts of empty vector control and TFG-silenced cells were analyzed by western blot after UVB treatment (25J/m2). Both endogenous FANCD2-V2 and FANCD2-V1 were detected with each specific antibody. The peak level of activated FANCD2-V2 was undetectable or postponed in TFG-expression compromised cells, but not FANCD2-V1 (indicated by red arrowheads and the relative ratio graphs). (C) Live images were taken on control and TFG-silenced cells co-transfected with GFP-FANCD2-V2 and RFP-FANCD2-V1, and photos were taken in a 30min interval. Green fluorescent intensity (FANCD2-V2 protein) was low and spread mainly in cytoplasm of TFG-silenced cells comparing to the control cells carrying a normal level of TFG expression. But there is not much difference for RFP-FANCD2-V1 (red fluorescent intensity) between two types of cells (Supplementary Videos 1 and 6). The fluorescence changes were similarly shown in relatively-elevated fluorescence (Supplementary Figure 4D). (D) TFG protects FANCD2-V2 from the proteasome-mediated degradation. EV control or TFG silenced cells were treated with 5μM MG132 for 6h. The corresponding whole cell lysates were analyzed by antibodies targeting FANCD2-V2 and FANCD2-V1 respectively. The protein levels of FANCD2-V2 were substantially elevated while blocking proteasome function (MG132 treatment), comparing to FANCD2-V1. Further, TFG modulation of FANCD2-V2 expression does not involve FANCD2-V2 transcription. Both mRNA levels of FANCD2-V1 or V2 are similar between cells carrying a normal or silenced level of TFG expression (through RT-PCR). (E) mtTFGΔaa5-100 or mtFANCD2-V2Δaa1437-1442 elevates cell oncogenicity. Trans-well and cell proliferation were performed using cells expressing mtTFG or mtFANCD2. Cells carrying mtTFGΔaa5-100 or mtFANCD2-V2Δaa1437-1442 both showed a similar level of elevation in cell proliferation and cell migration. Statistical calculations were shown in Supplementary Figure 4C. (F) Working hypothesis of TFG contributions to early DDR delivered by FANCD2-V2. In cells carrying a normal level of TFG expression, FANCD2-V2 responds to genotoxic stresses earlier than FANCD2-V1 (closer to DNA in drawing). However, in cells carrying a compromised level of TFG expression, a less amount of FANCD2-V2 goes into the nucleus owing to a relatively higher amount of FANCD2-V2 undergoing degradation