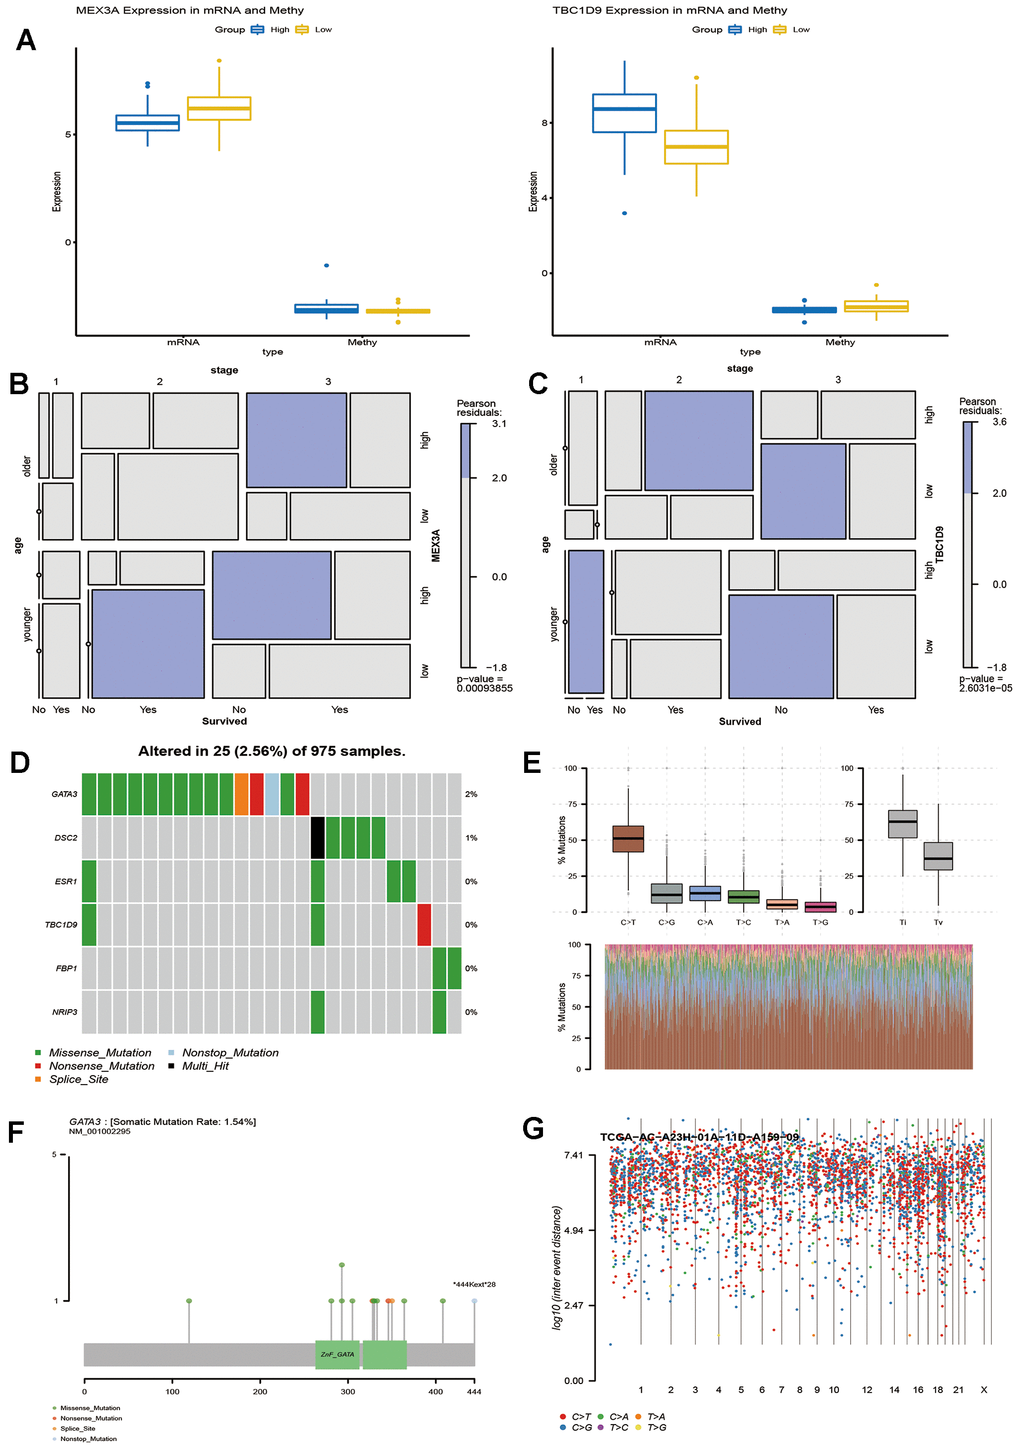
Figure 6.Potential factors affecting key genes that influence the survival time of breast cancer patients. (A) Methylation level and expression of MEX3A and TBC1D9 in breast cancer patients with survival times greater than or less than 5 years. Mosaic analysis identified the relationship between the expression of MEX3A (B) or TBC1D9 (C) and the prognosis and clinical information of breast cancer. (D). Six key genes were sequenced according to their mutation frequency. Different colours represent different methods of mutation. (E) The transition and crosscut graphs show the distribution of SNV in breast cancer with six transition and crosscut events. The stacked bar graph (bottom) shows the mutation spectrum distribution of each sample. (F) The Lollipop map shows the mutation distribution and protein domain of GATA3 with a high frequency of mutation. (G) The Rainfall map of TCGA-AC-A23H-01A-11D-A159-09 breast cancer sample. Each point is a mutation colour coded according to the SNV classification.