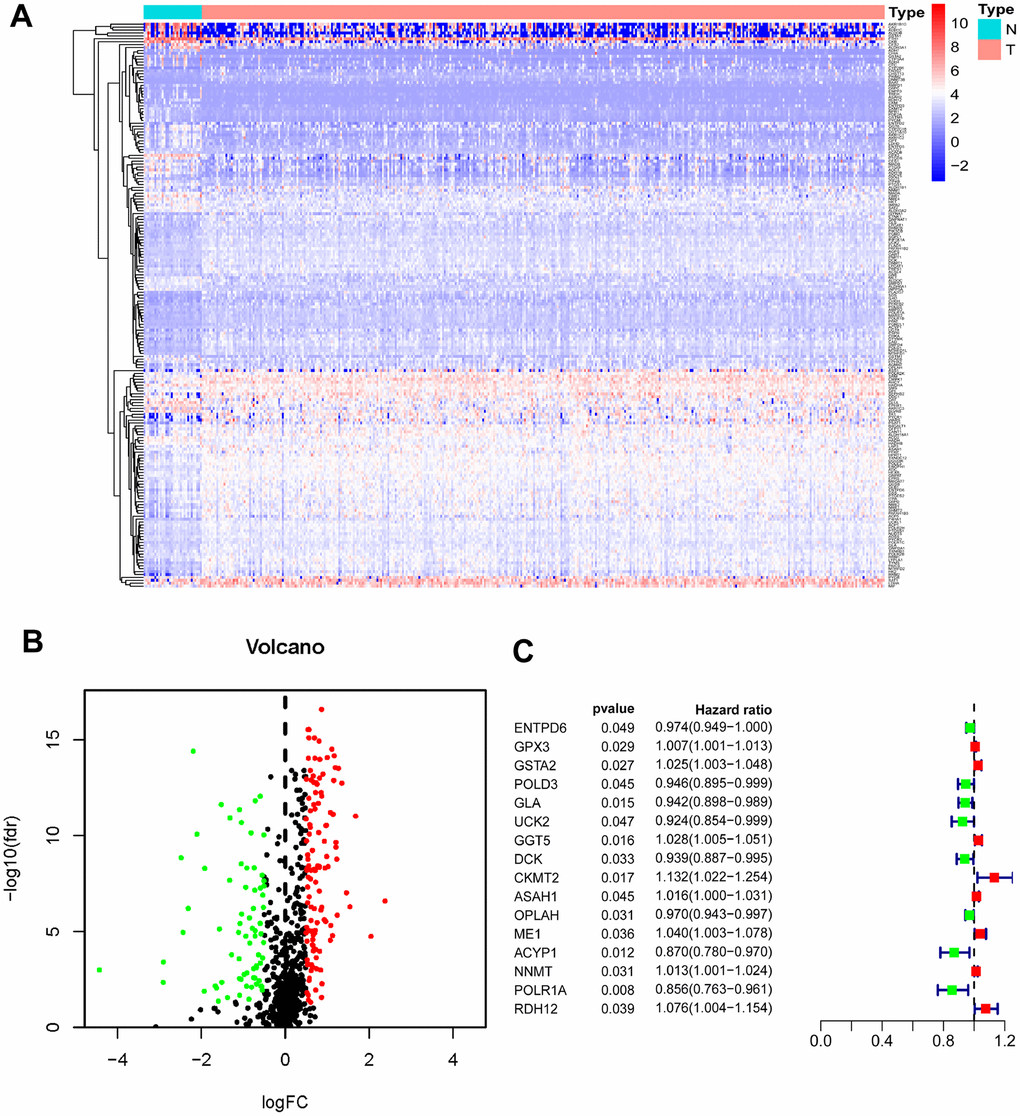
Figure 1.Identification of PDEMRGs. (A) Heatmap of DEMRGs: the red to blue spectrum signifies high to low gene expression. (B) Volcano plot of DEMRGs: red indicates upregulated DEMRGs, green indicates downregulated DEMRG, and black indicates DEMRGs that were not significantly differentially expressed. (C) Forrest plot of PDEMRGs: The red represents high-risk genes (hazard ratios, HR > 1); the green represents low-risk genes (HR < 1).