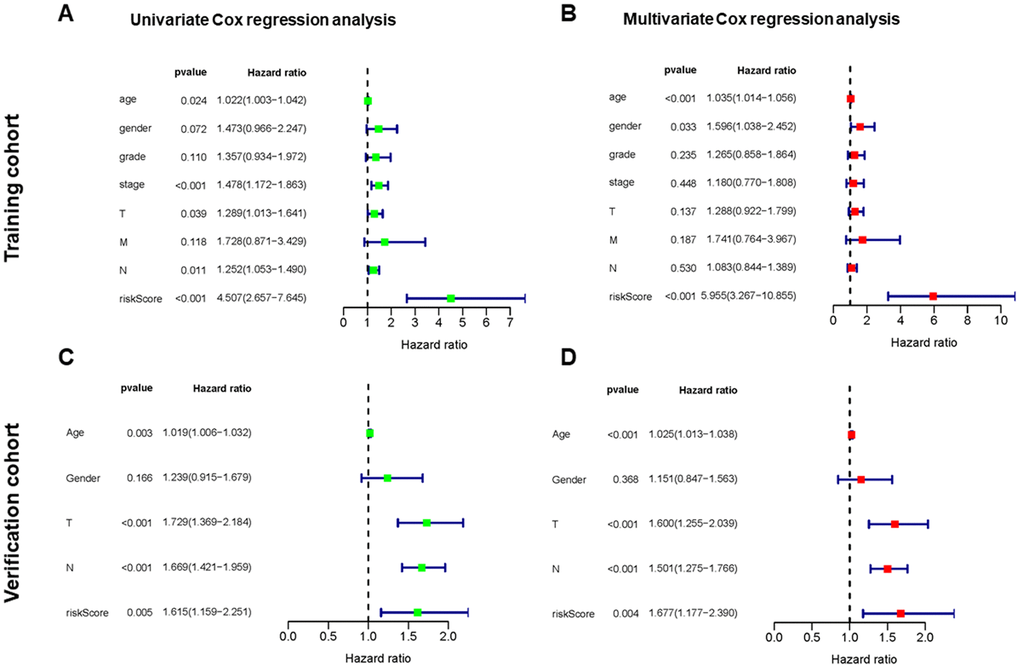
Figure 4.Independent value of the prognostic risk model. (A, B) Forrest plots of the univariate and multivariate Cox regression analysis in training cohort. (C, D) Forrest plot of the univariate and multivariate Cox regression analysis in verification cohort.