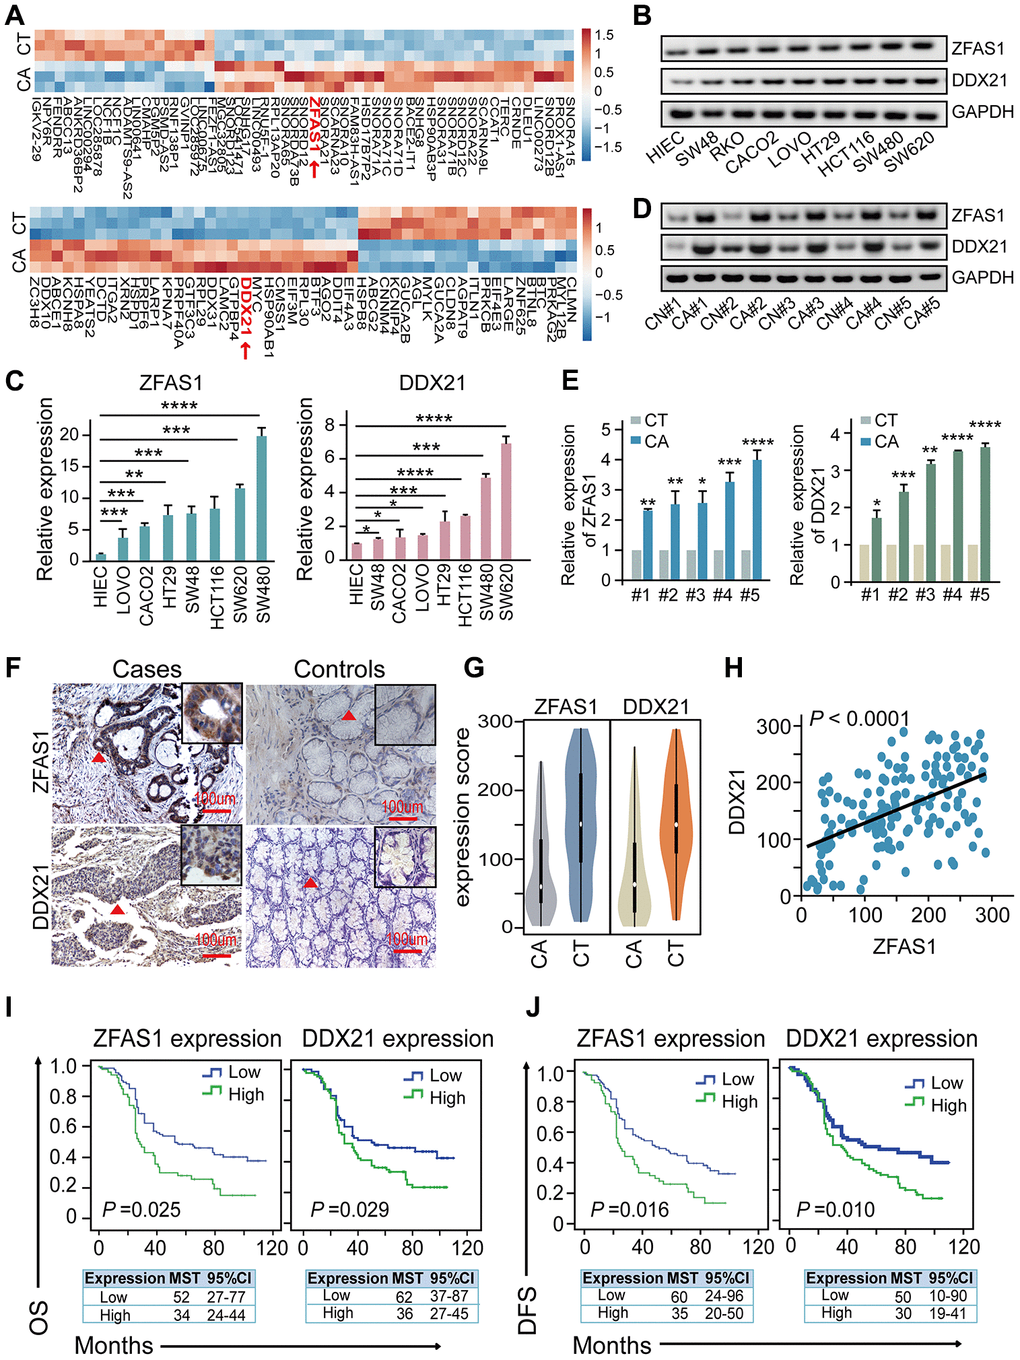
Figure 1.The association of lncRNA ZFAS1 and DDX21 expression in CRC cells and tissues. (A) The hierarchical clustering heat map illustrating the most differentially expressed lncRNAs and mRNAs in CRC patient tissues and their matched paired adjacent-tumor samples (n = 3), selected top 20 up-regulated or down-regulated genes (P<0.05). Red in heat map denotes up-regulation. Blue denotes down-regulation. (B and C) The expression levels of lncRNA ZFAS1 and DDX21 in normal intestinal epithelial HIEC cell and CRC cells including SW480, SW620, SW48, HCT116, RKO, CACO2, LOVO, and HT29 cells detected by RT-PCR (B) and qPCR assays (C). GAPDH was selected as an internal control. (D and E) Representative data of lncRNA ZFAS1 and DDX21 expression in paired CRC and matched adjacent-tumor controls detected by RT-PCR and qPCR assays (5 representative data was shown). (F) ISH method detected the cellular localization and the expression of lncRNA ZFAS1, and IHC assay determined the DDX21 expression based on this included CRC patient tissues and matched tumor-adjacent controls (n = 157). The bar represents 100μm. (G) Violin charts displaying the expression levels of lncRNA ZFAS1 and DDX21 in this included CRC cohort. Nonparametric tests and median (interquartile range) were shown. (H) Linear correlation pattern showing a positive relationship between the expression of lncRNA ZFAS1 and DDX21. (I and J) Kaplan-Meier plot curves showing the association of lncRNA ZFAS1 high/low expression, DDX21 high/low expression with the OS (I) and DFS (J) in this included CRC patients. * P <0.05; ** P <0.01; *** P <0.001; **** P <0.0001.