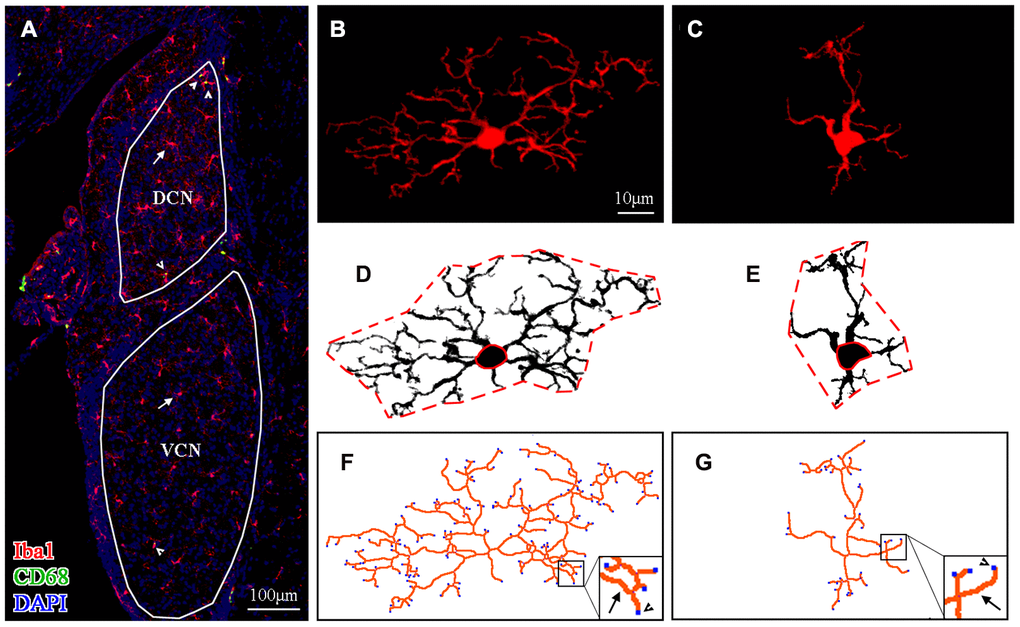
Figure 3.Morphological analysis of microglia. (A) A representative z-projection image of Iba1- and CD68-labeled sections showing the distribution of microglia in the brain region of interest (the VCN and DCN were delineated in this image). The long arrows point to the cells that were Iba1-positive only, and the short arrows point to cells that were both Iba1- and CD68-positive. The scale bar equals 100 μm. (B, C) Representative maximum intensity projections of confocal images of an Iba1-labeled ramified microglial cell (B) and an Iba1-labeled activated microglial cell (C). (D, E) The soma area and the territory area of microglia (in B and C) were delineated by a solid (soma area) red line and a dotted (territory area) red line (in D and E), respectively. (F, G) Maximum intensity projections of confocal images (B and C) were skeletonized. The total process length (orange lines, indicated by arrows in the enlarged insert) and the total number of process endpoints (blue spots, indicated by arrowheads in the enlarged insert) were summarized for statistical comparisons. The scale bar equals 10 μm (B–G).