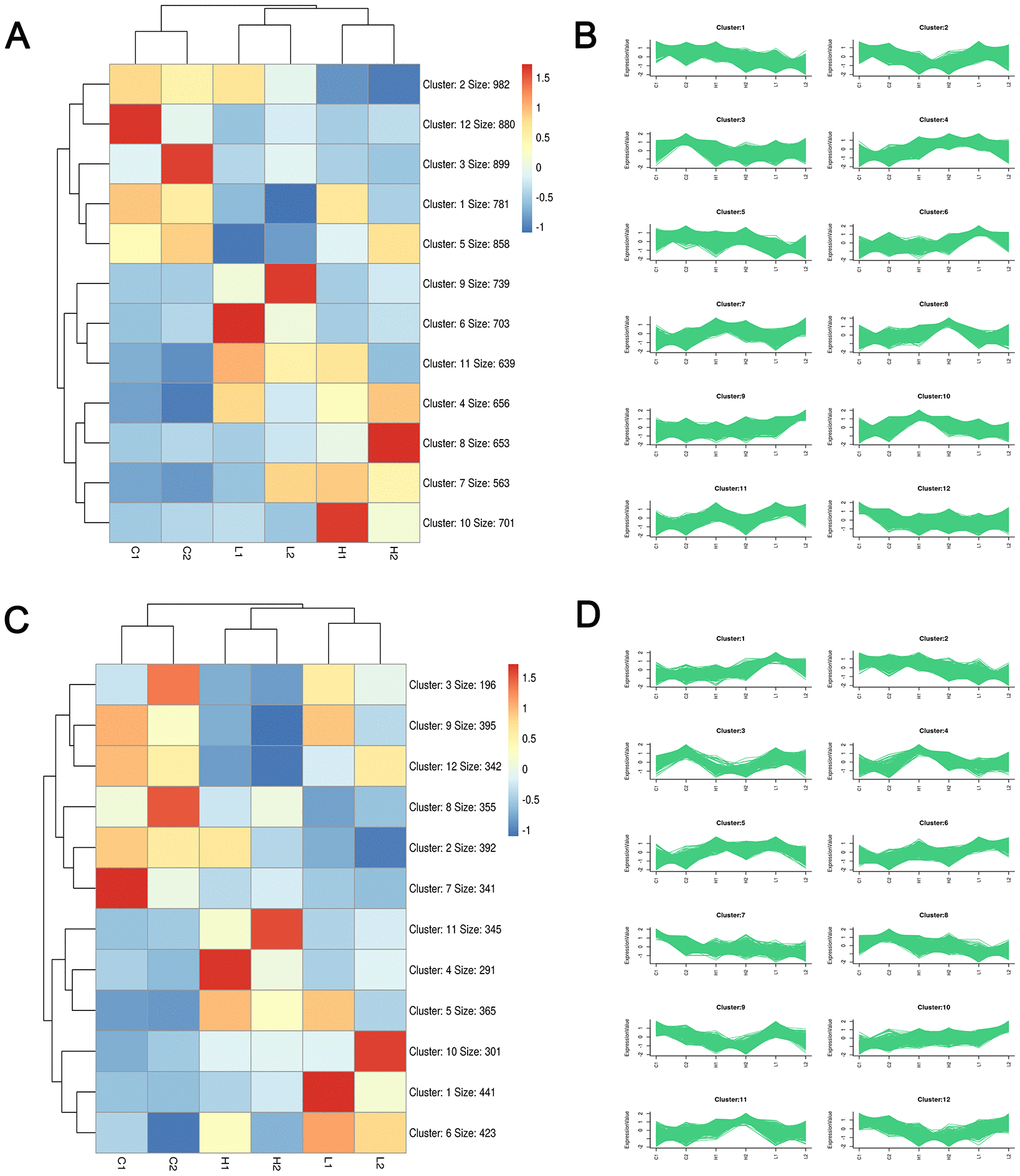
Figure 4.Clustering analysis plots based on Kmeans pattern recognition algorithm. Heatmap and sequence diagram of mRNA (A, B) and LncRNA (C, D) were obtained through EOC sample sequencing data analysis, respectively. Red, blue, and white colors respectively represent the relatively high, low, and equal expression.