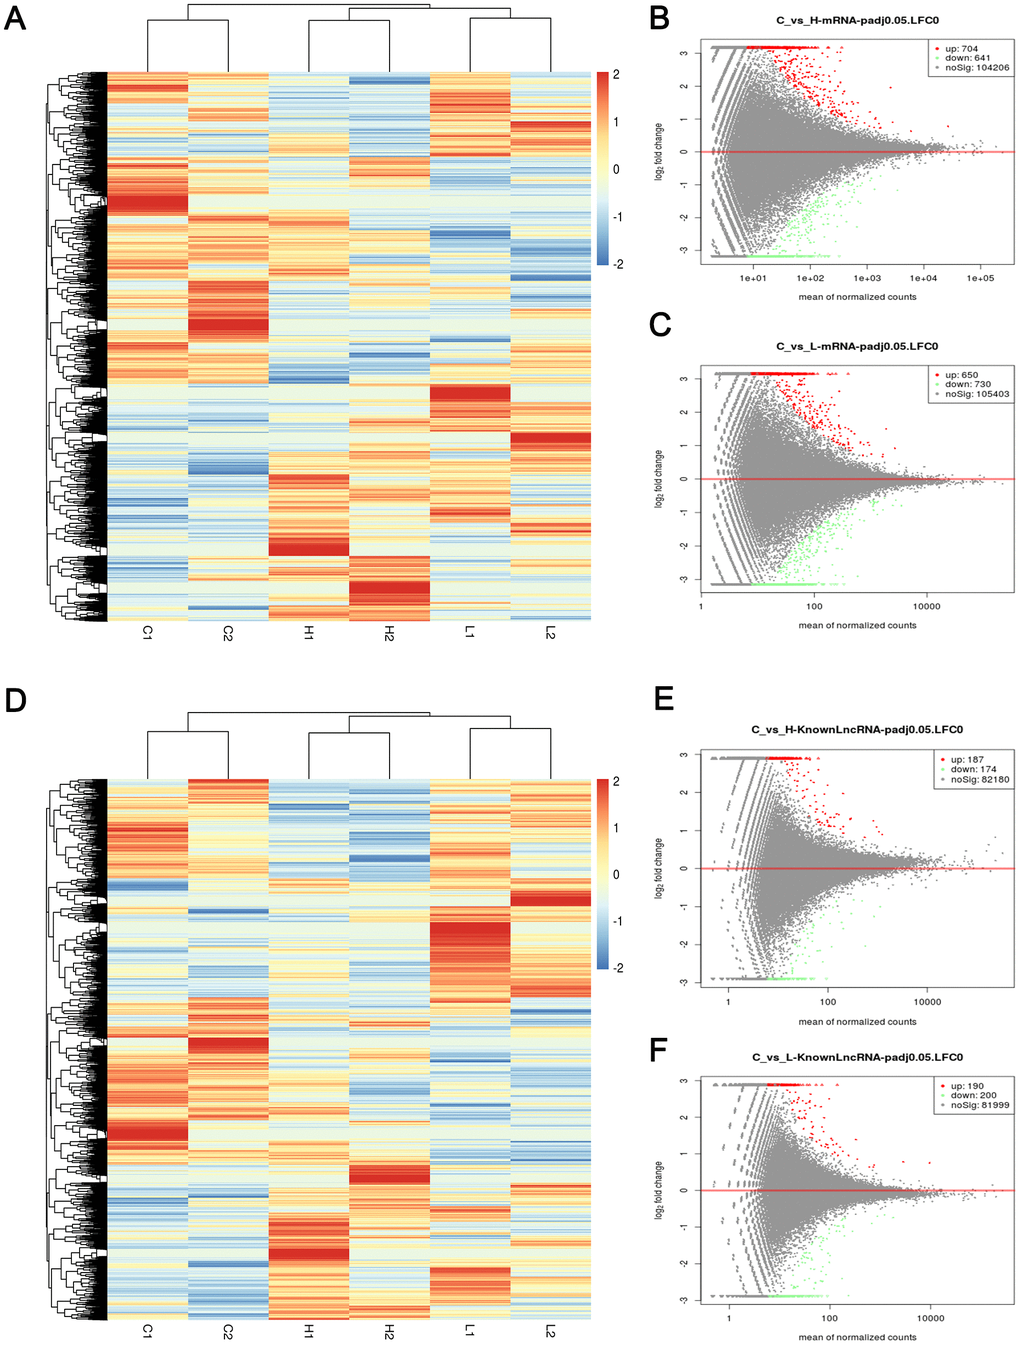
Figure 5.Heatmap and volcano maps of DEMs and DELs. (A) Heatmap based on mRNA sequencing data of 6 samples; (B, C) volcano maps based on mRNA sequencing data of group C versus group H (up-regulated:704, down-regulated: 641) and group C versus group L (up-regulated:650, down-regulated: 730); (D) Heatmap based on LncRNA sequencing data of 6 samples; (E, F) volcano maps based on LncRNA sequencing data of group C versus group H (up-regulated: 187, down-regulated: 174) and group C versus group L (up-regulated: 190, down-regulated: 200). Red, blue, and white colors respectively represent the relatively high, low, and equal expression in heatmap, while green, red, and black colors respectively represent relatively low, high, and equal expression in volcano maps. Group C, L and H represent control (6 kPa), low (1 kPa) and high (60 kPa) group, respectively.