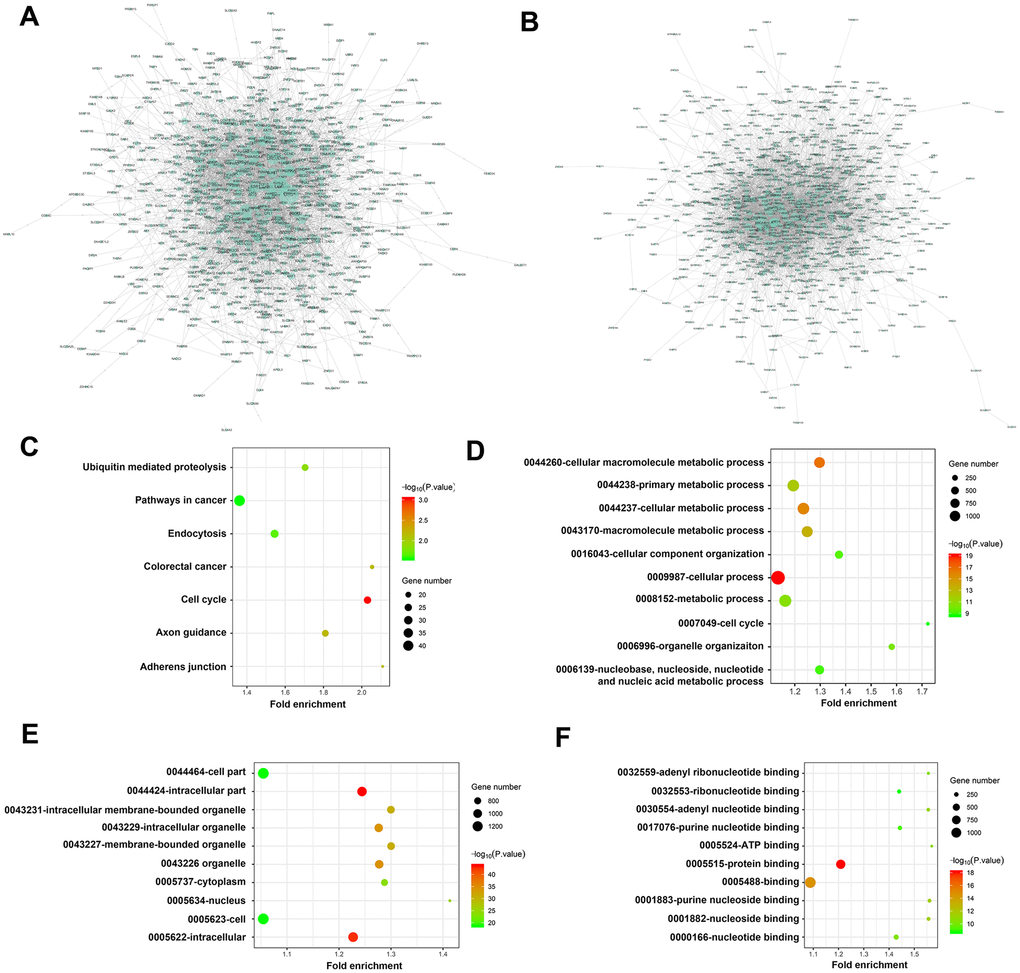
Figure 6.Visualization analysis of PPI network, KEGG pathways and GO terms. (A) Network of 1101 DEMs between C and L group (917 nodes and 4735 edges); (B) Network of 1082 DEMs between C and H group (800 nodes and 3738 edges); KEGG pathway enrichment was shown in (C) biological process, cellular component and molecular function terms were shown in D, E, F, respectively. The cutoff criterion was p < 0.05, and the first 10 pathways are shown. Group C, L and H represent control (6 kPa), low (1 kPa) and high (60 kPa) group, respectively.