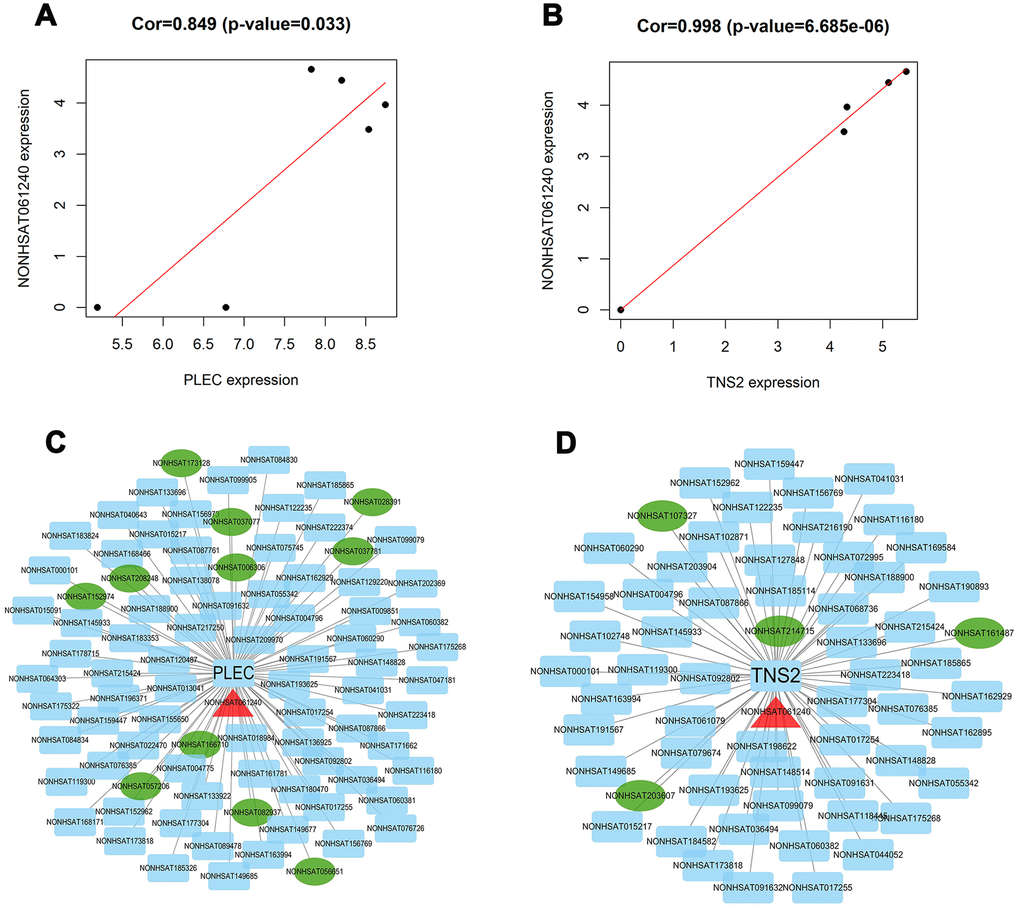
Figure 8.Identification of key lncRNAs associated with TNS2 and PLEC. (A, B) co-expression analysis was performed by using the Pearson correlation in R package. lncRNA NONHSAT061240 was found to be significantly associated with PLEC (score: 0.849) and TNS2 (score: 0.998); (C, D) Visualization network of two lncRNA-mRNA interaction pairs prediction mode. Except for TNS2 and PLEC at the center, the blue rectangle represents the associated LncRNAs obtained by the co-expression model, the green ellipse represents the associated LncRNAs obtained by the trans-cis model, and the red triangle represents the shared LncRNA.