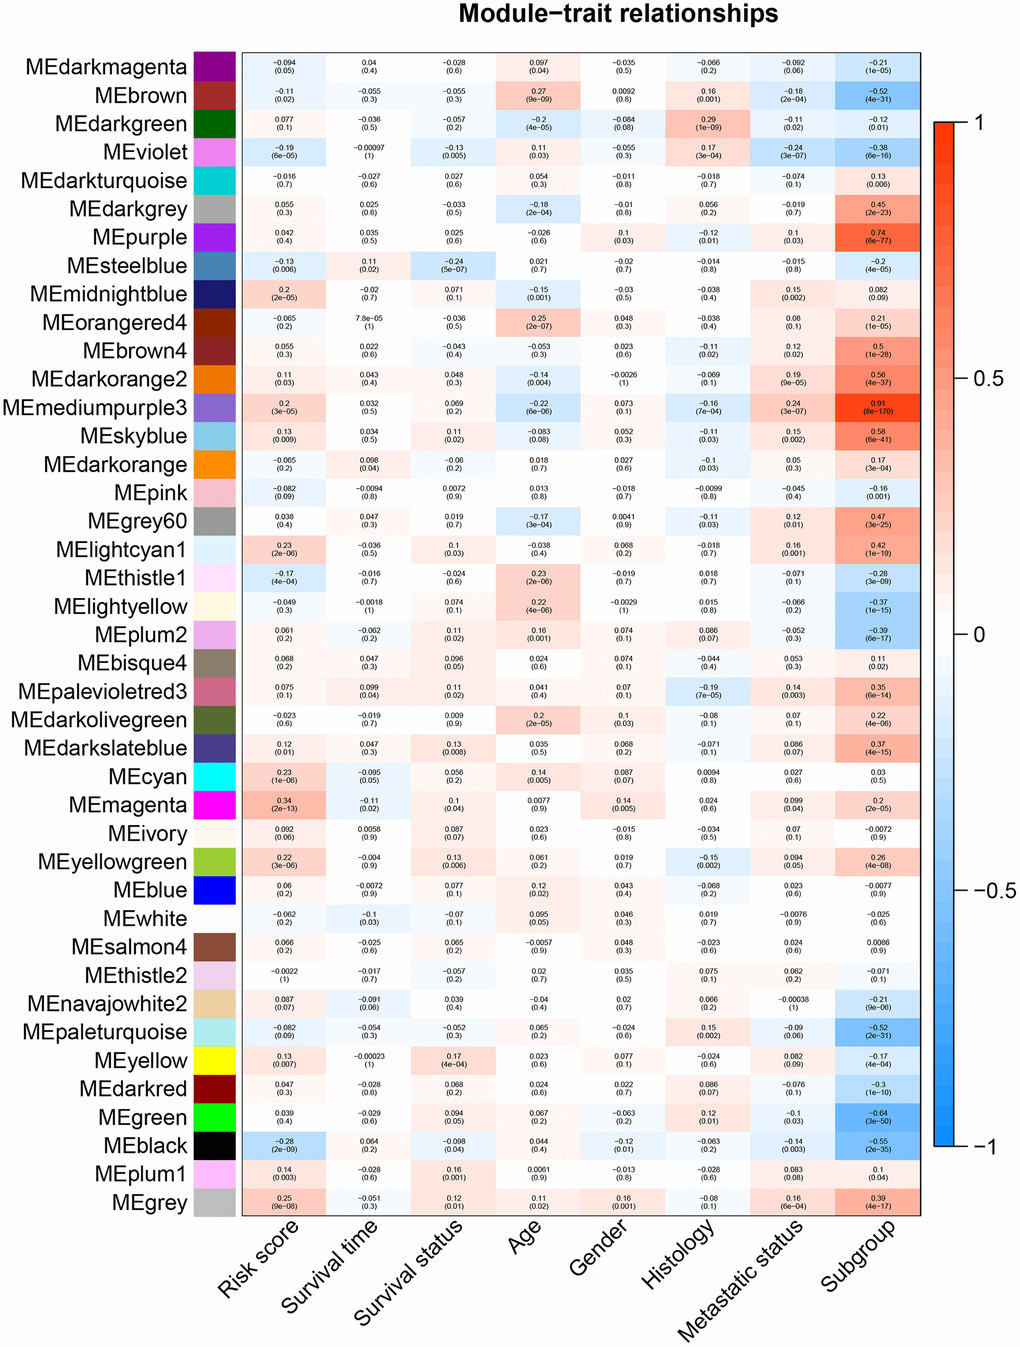
Figure 6.Heatmap of the correlation between gene modules and clinical traits of MB. Each row in the heatmap corresponds to a module, and each column in the heatmap corresponds to a specific clinical characteristic. Each cell contains the corresponding correlation coefficient and p-value.