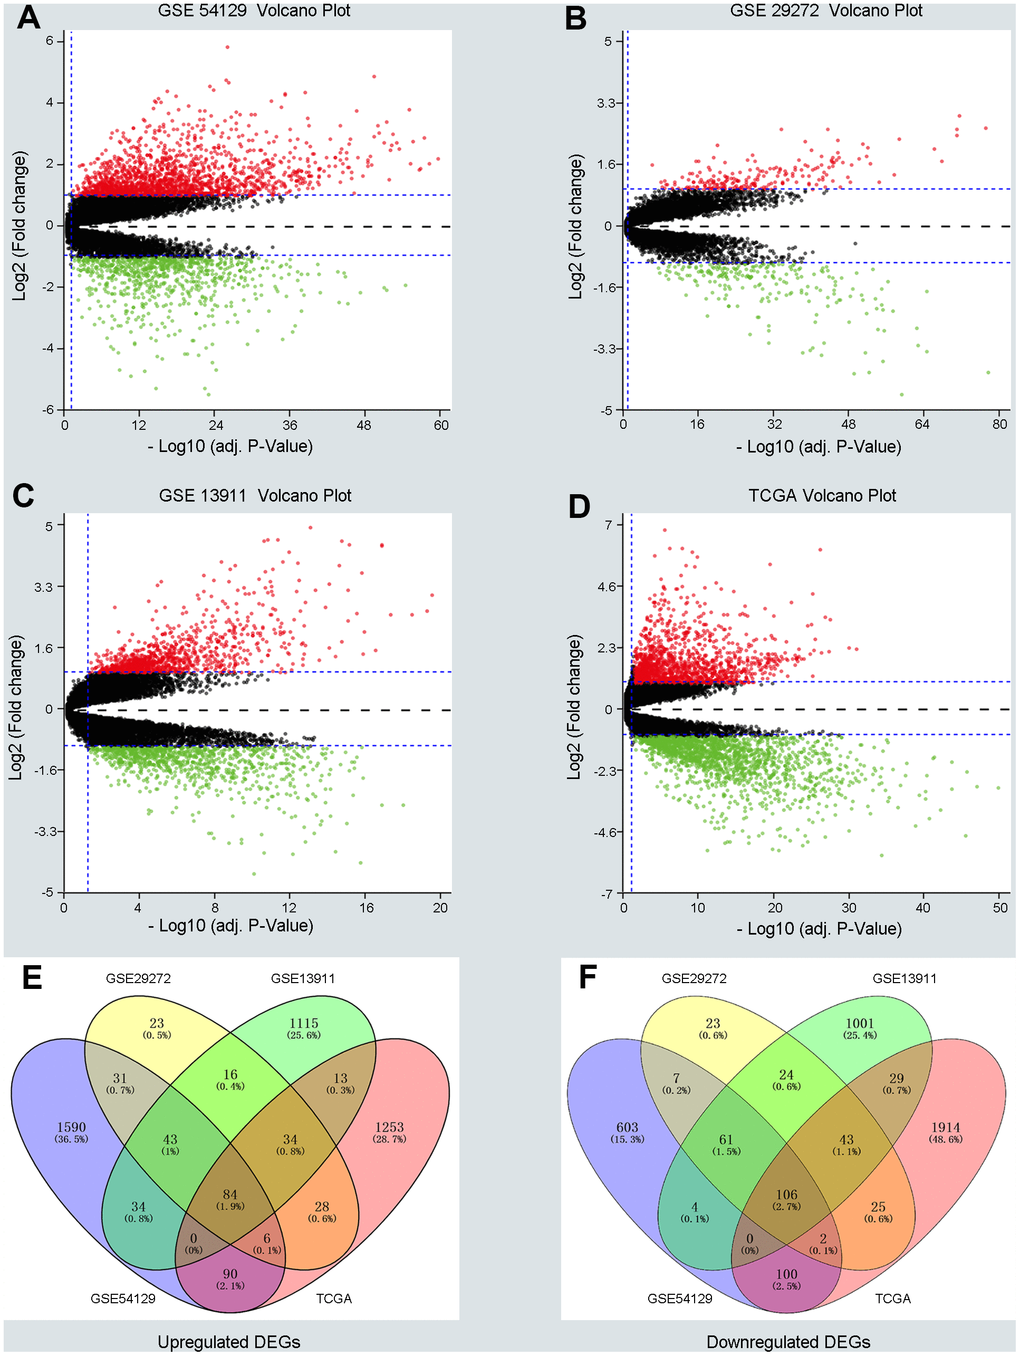
Figure 1.Screening differentially expressed genes (DEGs) between gastric cancer (GC) and normal samples in three GEO datasets and TCGA database. (A–D) The volcano plots of DEGs in GSE54129, GSE29272, GSE13911 and TCGA datasets with thresholds of |log2FC| > 1, adjust P value < 0.05. The red dots and green dots represent the upregulated and downregulated DEGs separately. The black dots mean no significantly different genes. (E, F) The intersection of upregulated DEGs and downregulated DEGs in four datasets, respectively.