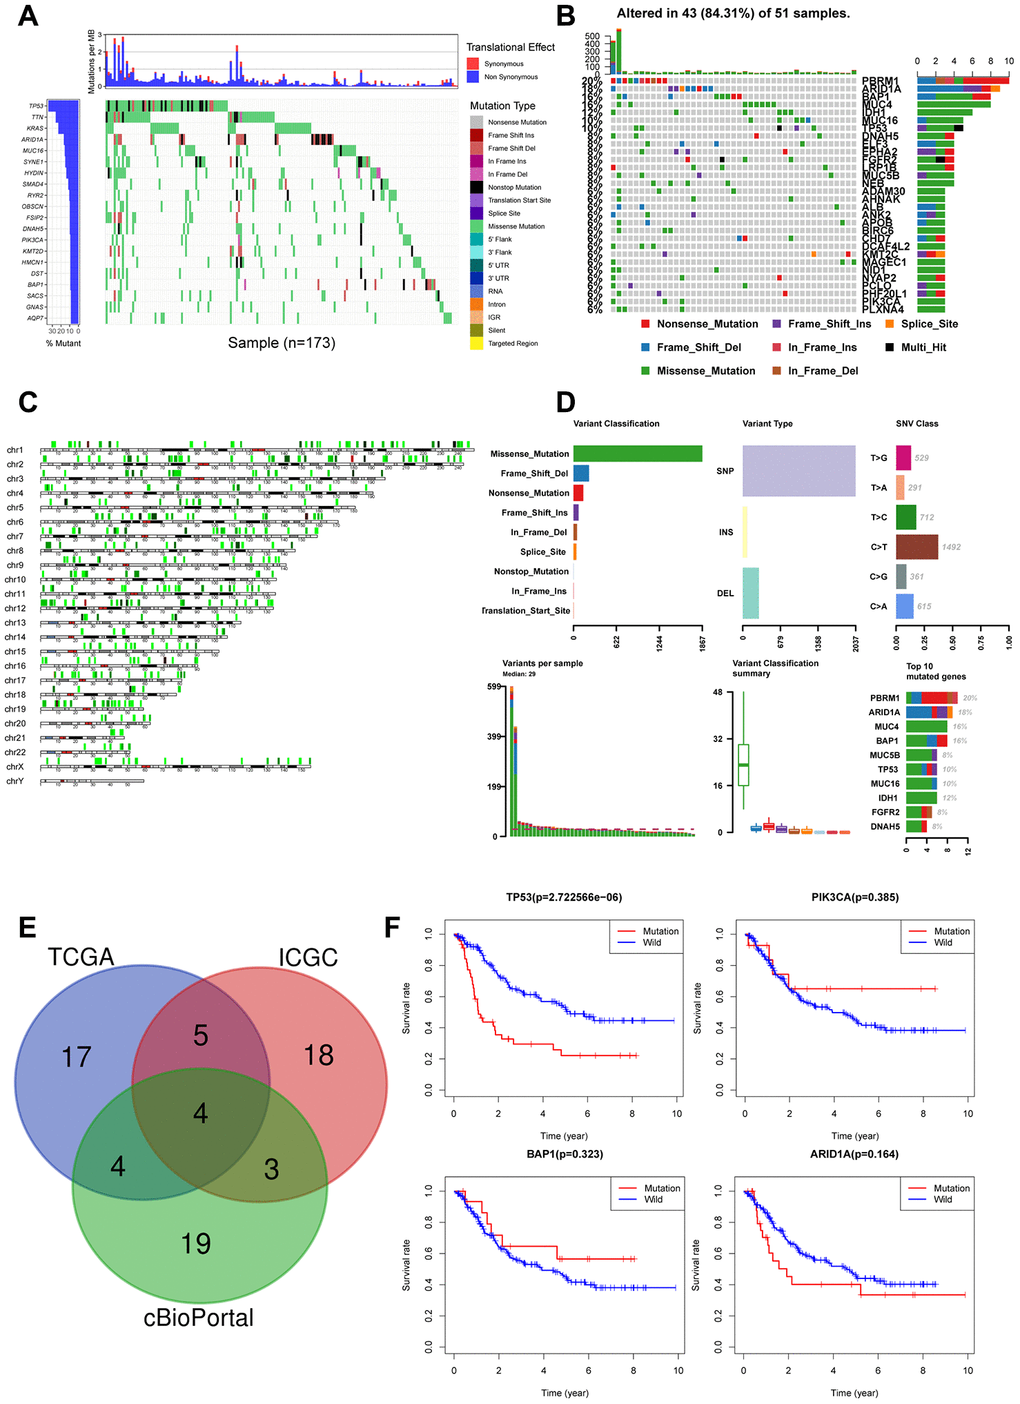
Figure 4.Landscape of somatic mutations in CCA (A) Waterfall plot depicts the frequencies and the mutation types of mutated genes in CCA from ICGC cohort. The left bar chart shows the TOP20 mutant genes frequencies of mutation. The bottom bar chart shows the mutation types; (B) Waterfall plot shows the mutated genes in CCA from TCGA cohort. The right bar chart shows the TOP30 mutant genes frequencies of mutation; (C) The positions of all the mutations in chromosomes, lower mutation frequency location is labeled with green color, while higher labeled with red; (D) Summary of mutation types of TCGA CCA dataset; (E) Venn diagram of overlapped top30 mutant genes of the three datasets respectively; (F) Overall survival analysis of four overlapped mutant genes.