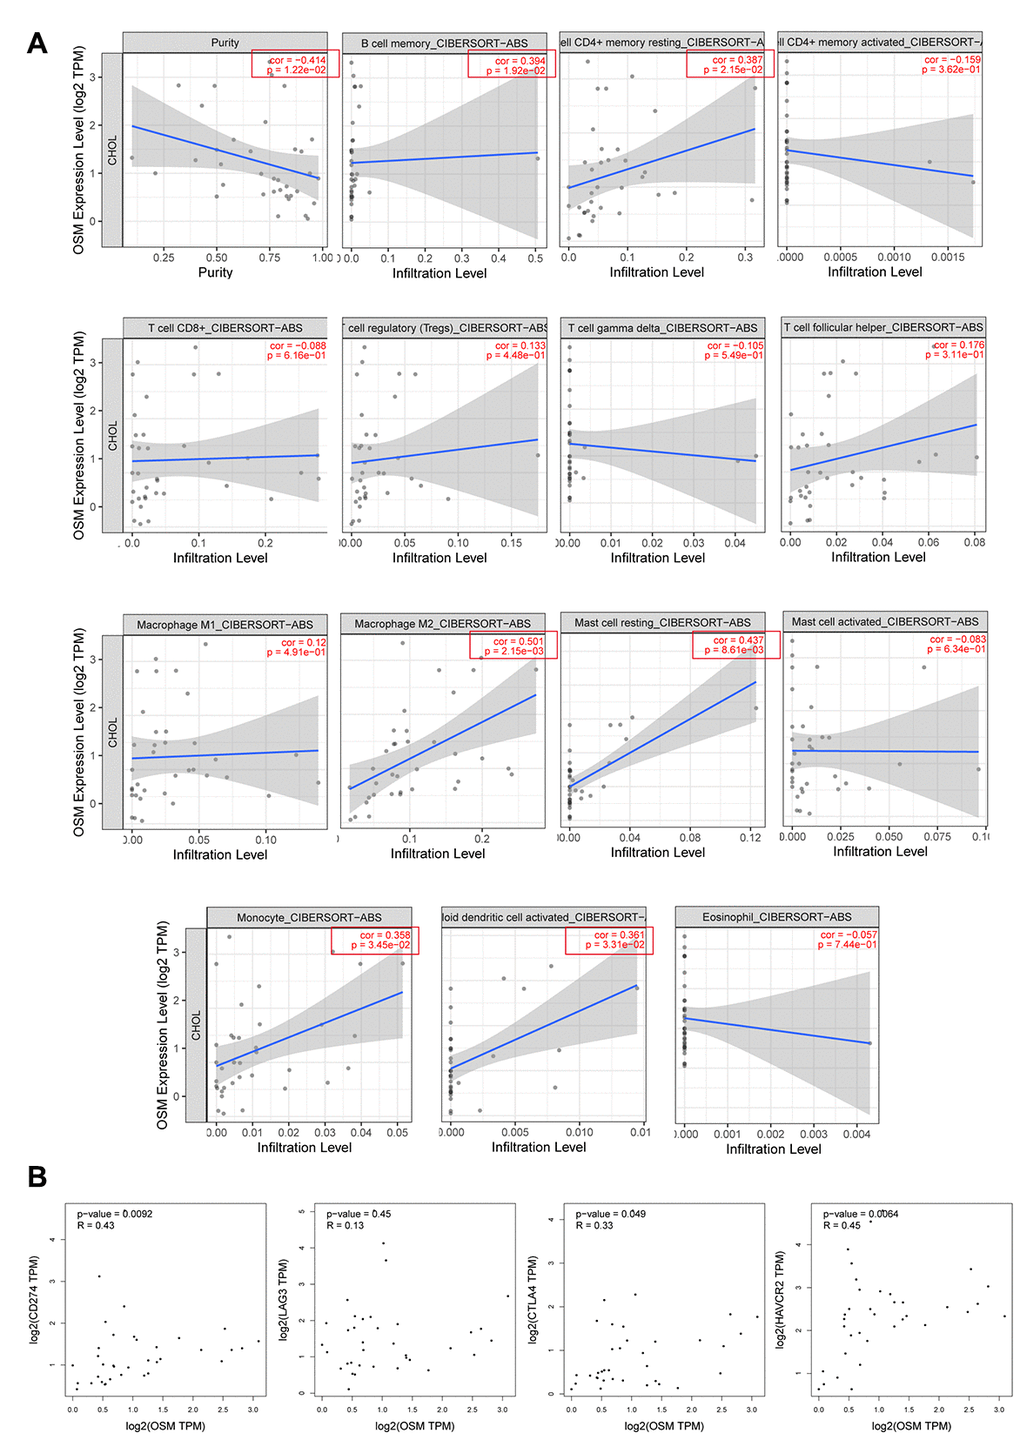
Figure 7.The Correlations of OSM Expression Level and Immune Infiltrating Cells in CCA. (A) The correlations with OSM expression level and the 15 types of immune infiltrating cells which are significant different between proliferation and inflammation groups of CCA; (B) The correlation between OSM expression and four immune checkpoints PD-L1 (CD274), CLTA4, LAG3, HAVCR2.