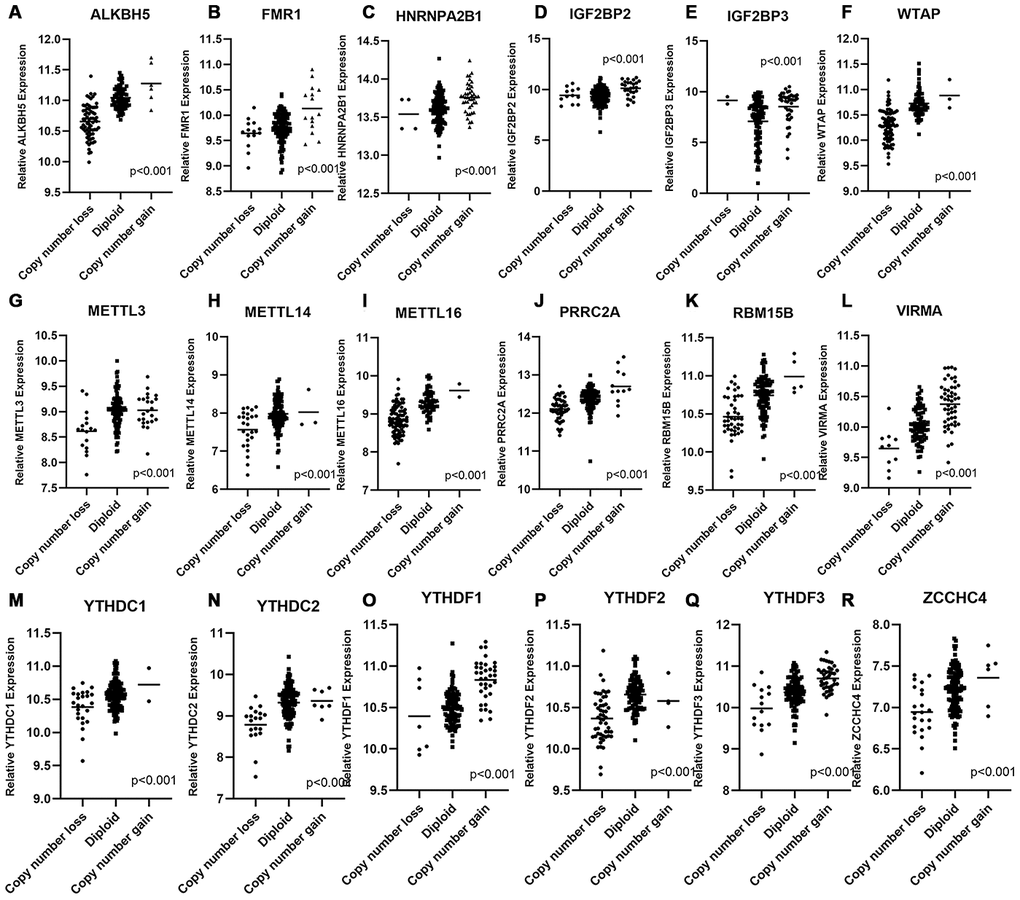
Figure 5.Correlation between different CNA patterns and mRNA expression levels of m6A regulatory genes respectively. (A–R) A total of 18 m6A regulatory genes showed significant correlation between their CNA patterns and mRNA expression. Only when p < 0.001 the gene was included in this figure, correlation plots of other m6A genes were listed in Supplementary Figure 4.
Figure 5 — Multiomics integrative analysis for gene signatures and prognostic values of m6A regulators in pancreatic adenocarcinoma: a retrospective study in The Cancer Genome Atlas project | Aging