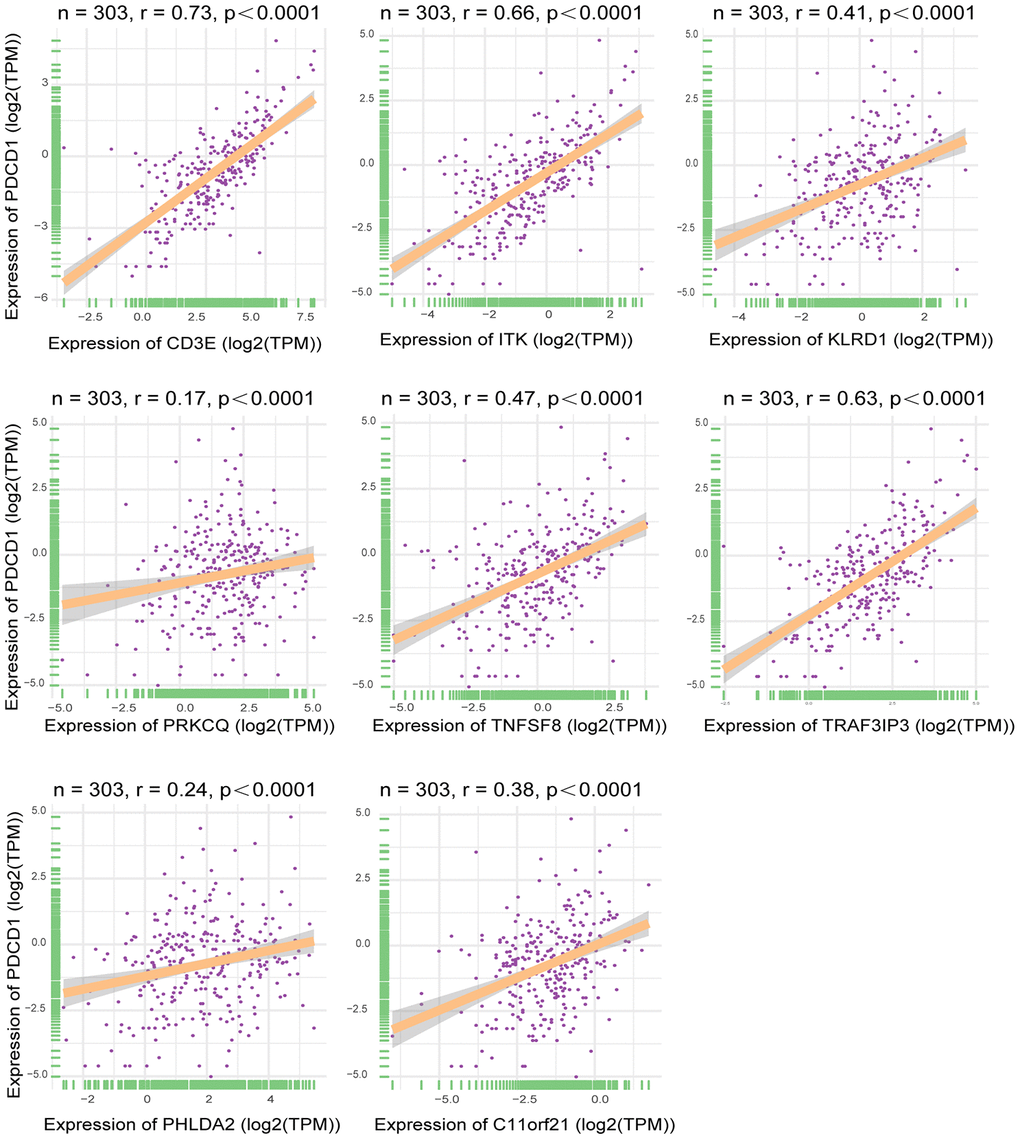
Figure 8.Correlation between expression of interested DEGs and immune checkpoint gene. Pearson correlation of expression and ImmuneScore dataset. The all 8 interested genes had significant correlation(p<0.05), especially CD3E, ITK and TRAF3IP3. X-axis represented expression level of 8 interested genes in each sample. Y-axis represented expression level of PDCD1 in each sample.